
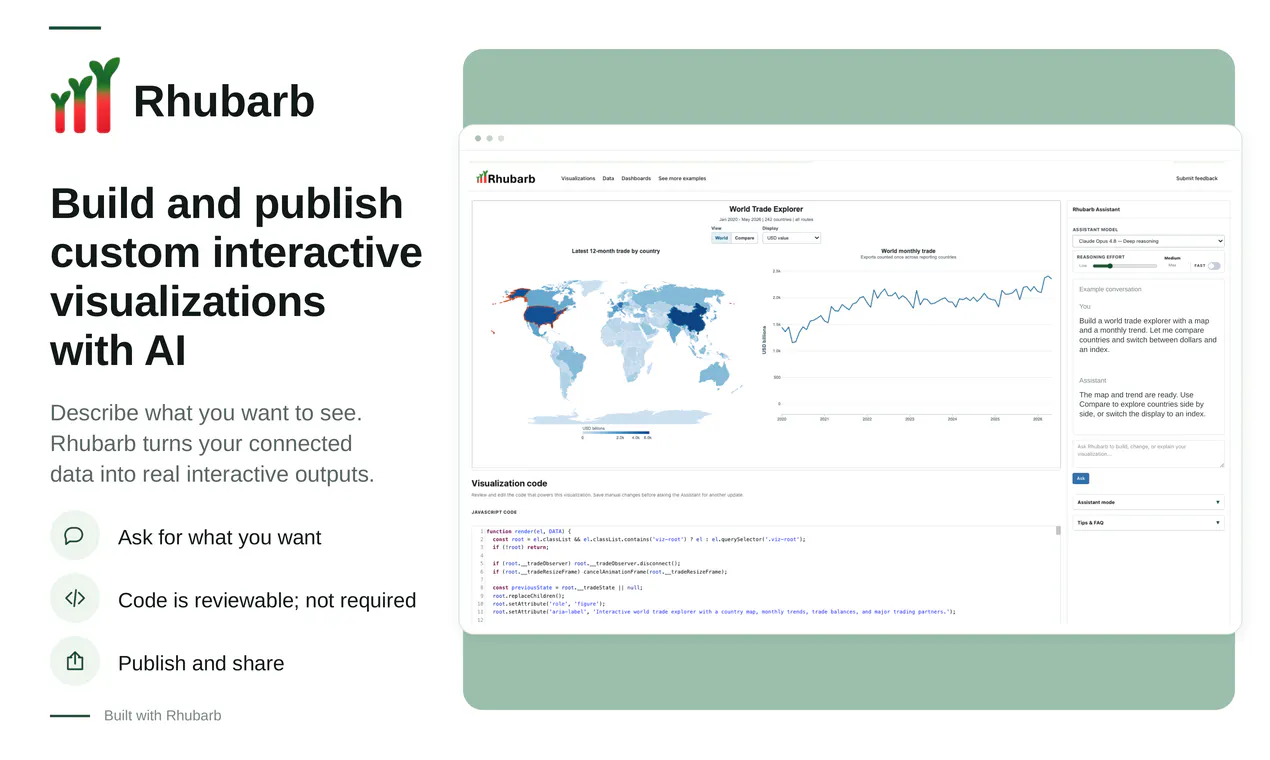
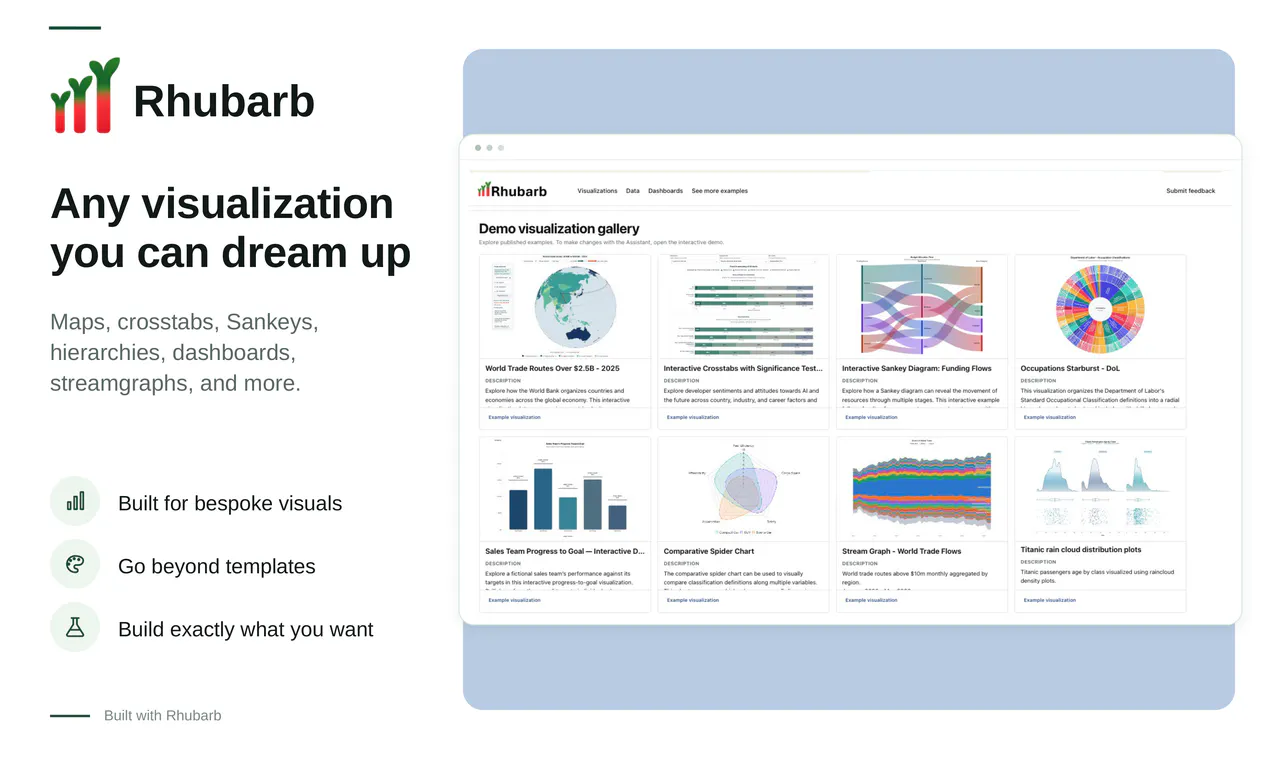
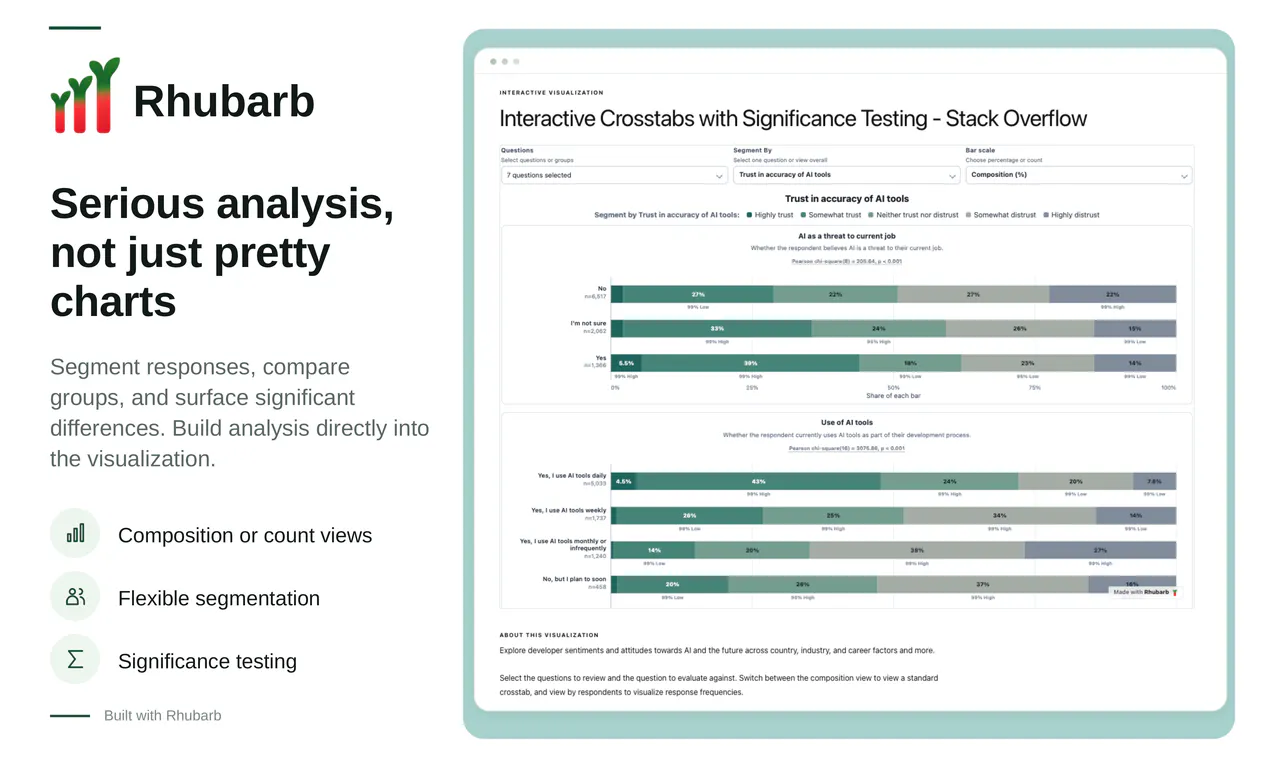
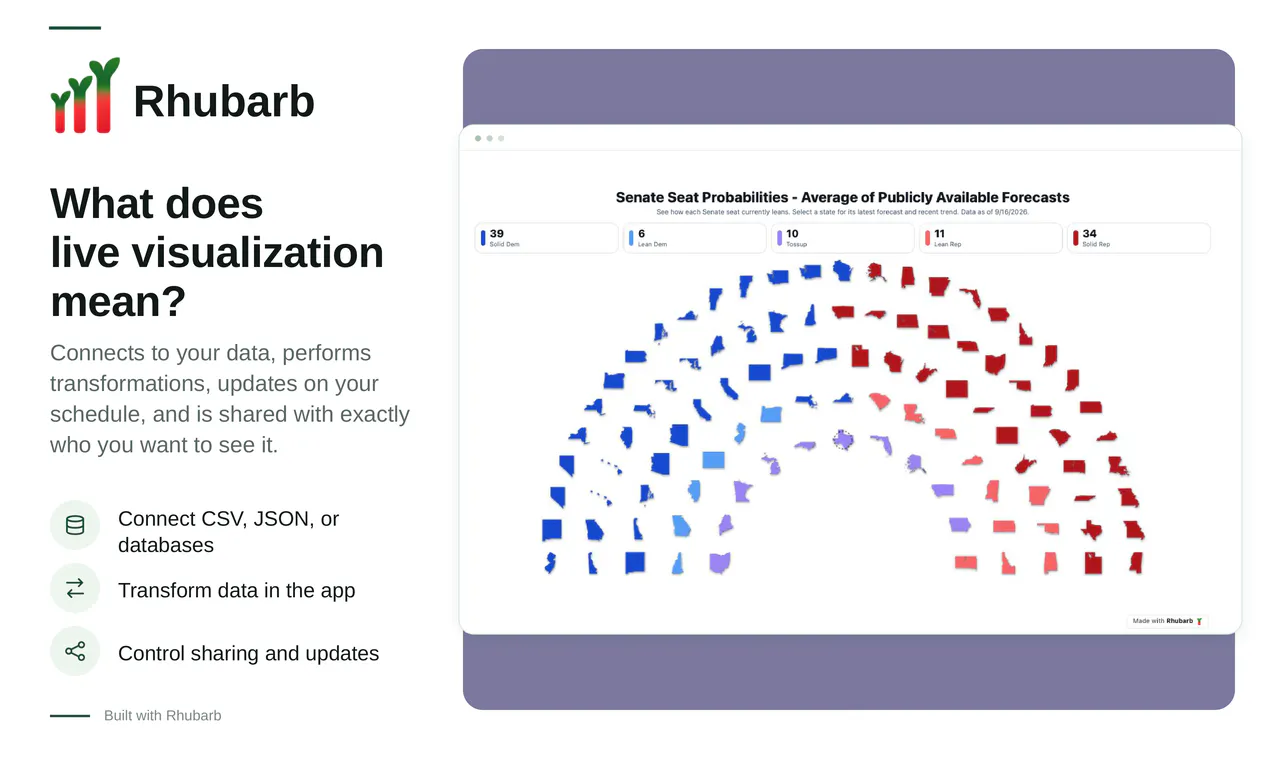
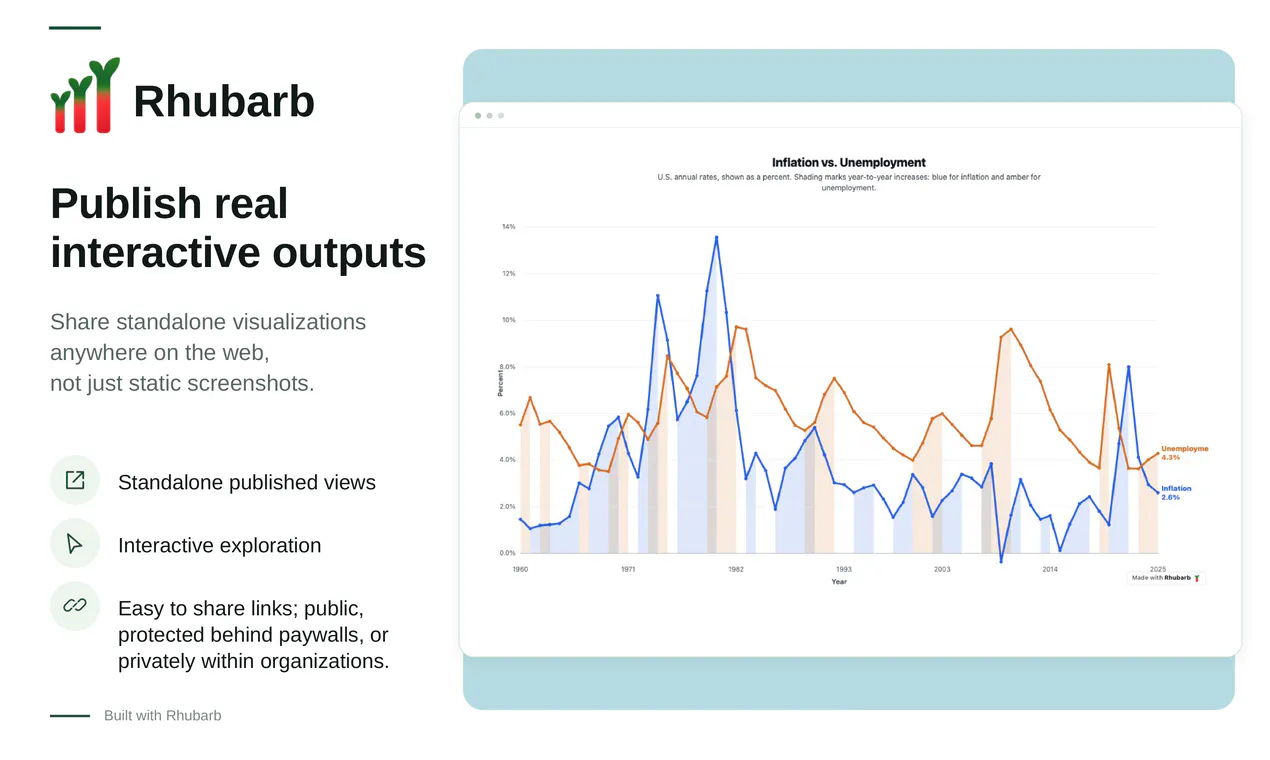
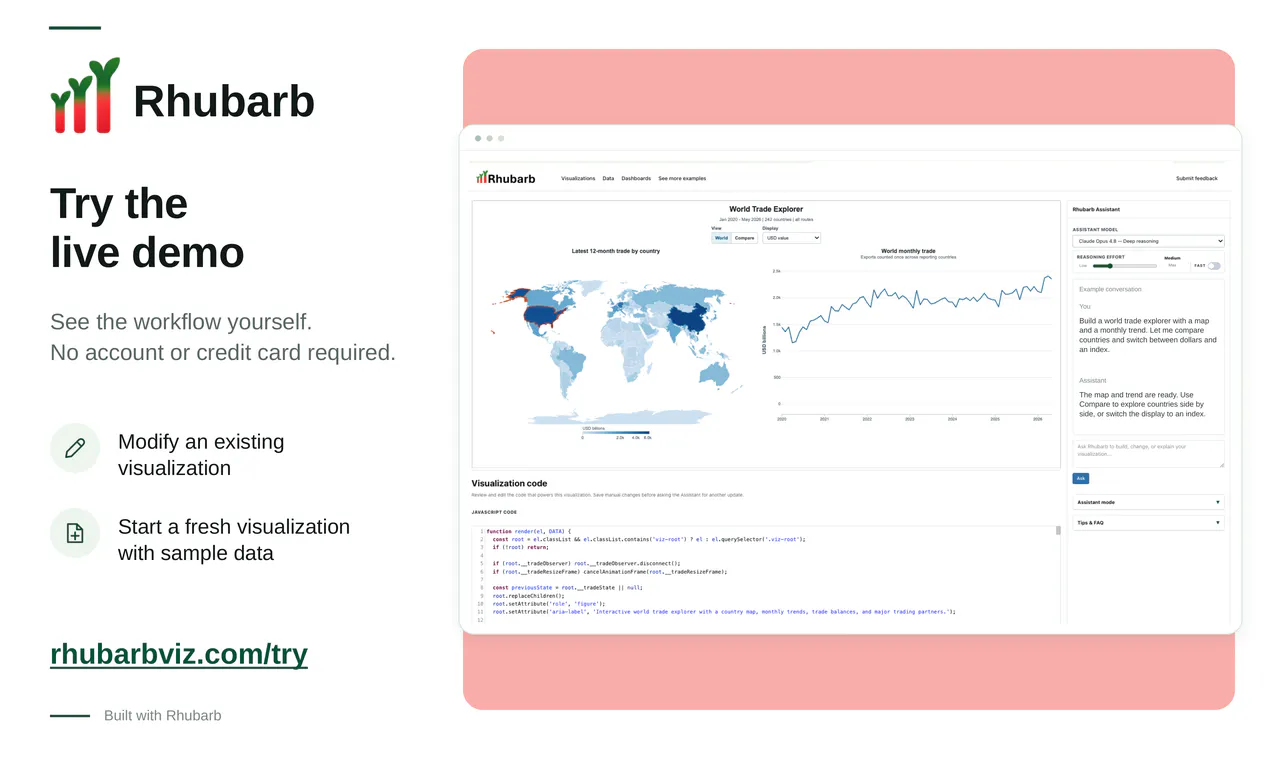
Rhubarb turns connected data into highly custom interactive visualizations with an AI assistant that writes the SQL and JavaScript while keeping the code visible and editable. Unlike chart generators or fixed dashboard tools, Rhubarb produces functioning, publishable visualizations that stay connected to their data, with hosting, sharing, access controls, and continued AI-assisted editing built into the same workflow. Skip the point-and-click interface—just ask for what you want to see.
Artificial IntelligenceData & AnalyticsData Visualization
广告位 (响应式横幅)
💬 用户评论
📋 基本信息
上线日期
2026年9月17日
点赞数
2
评论数
2
数据来源
网络公开数据
广告位 (响应式横幅)





该工具在 Product Hunt 上有 2 条评论。
在 Product Hunt 上查看评论 →