
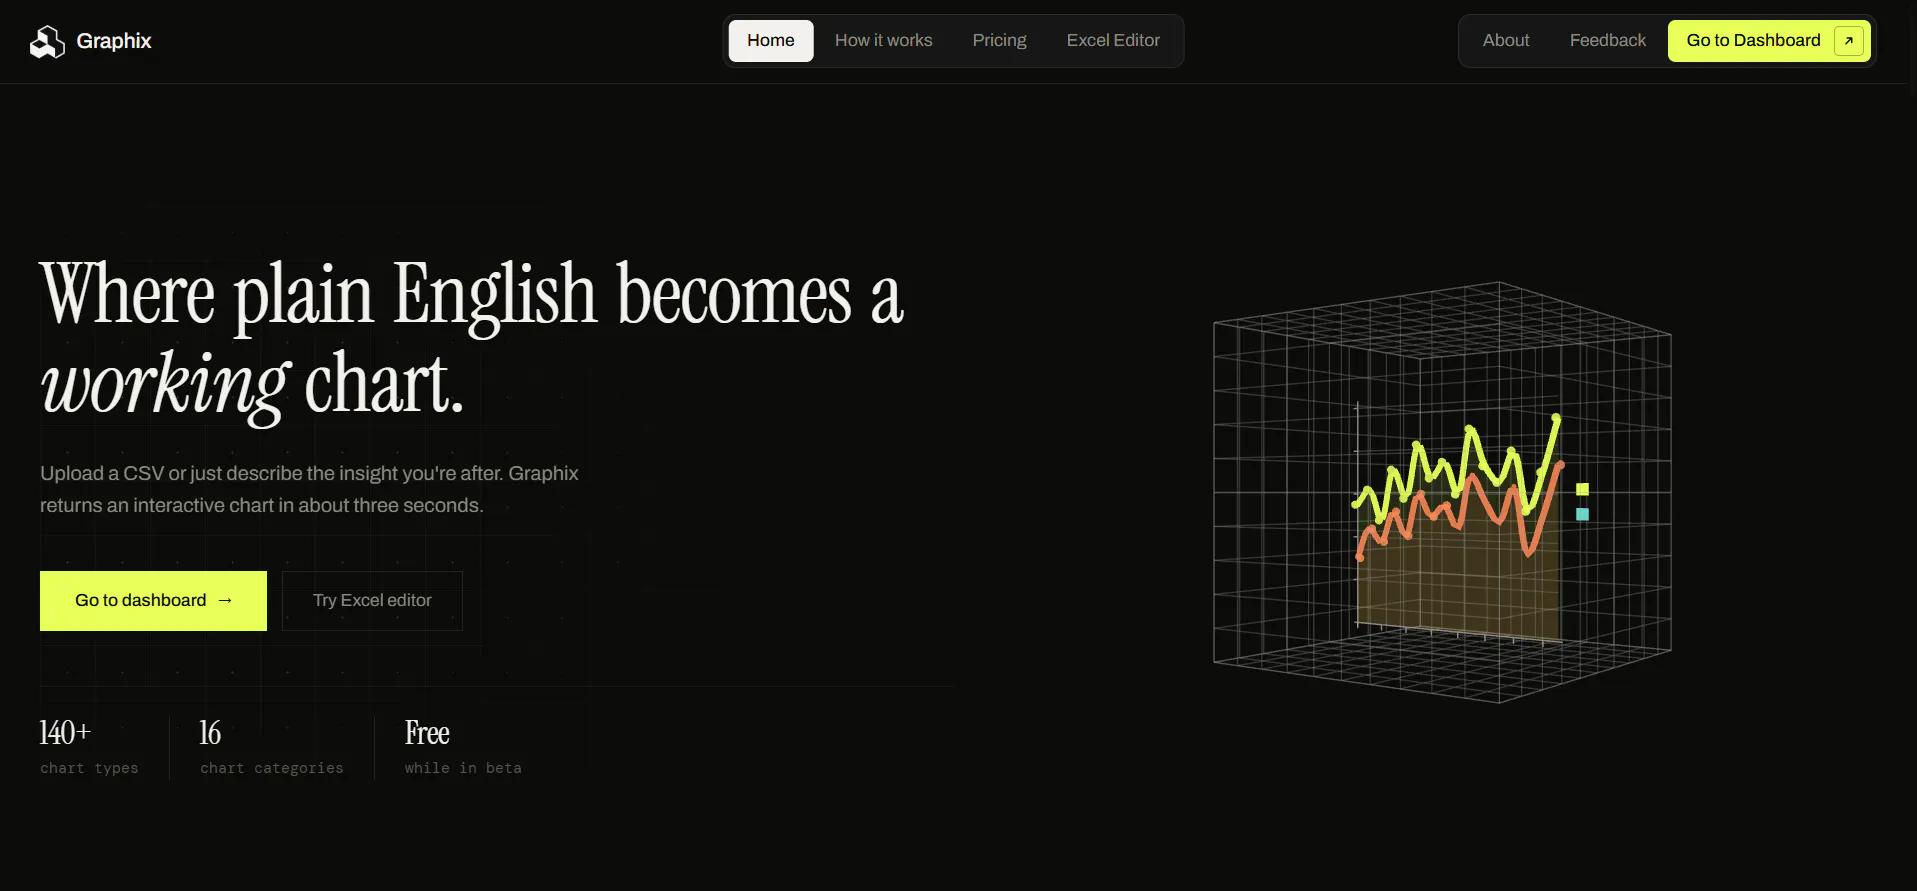
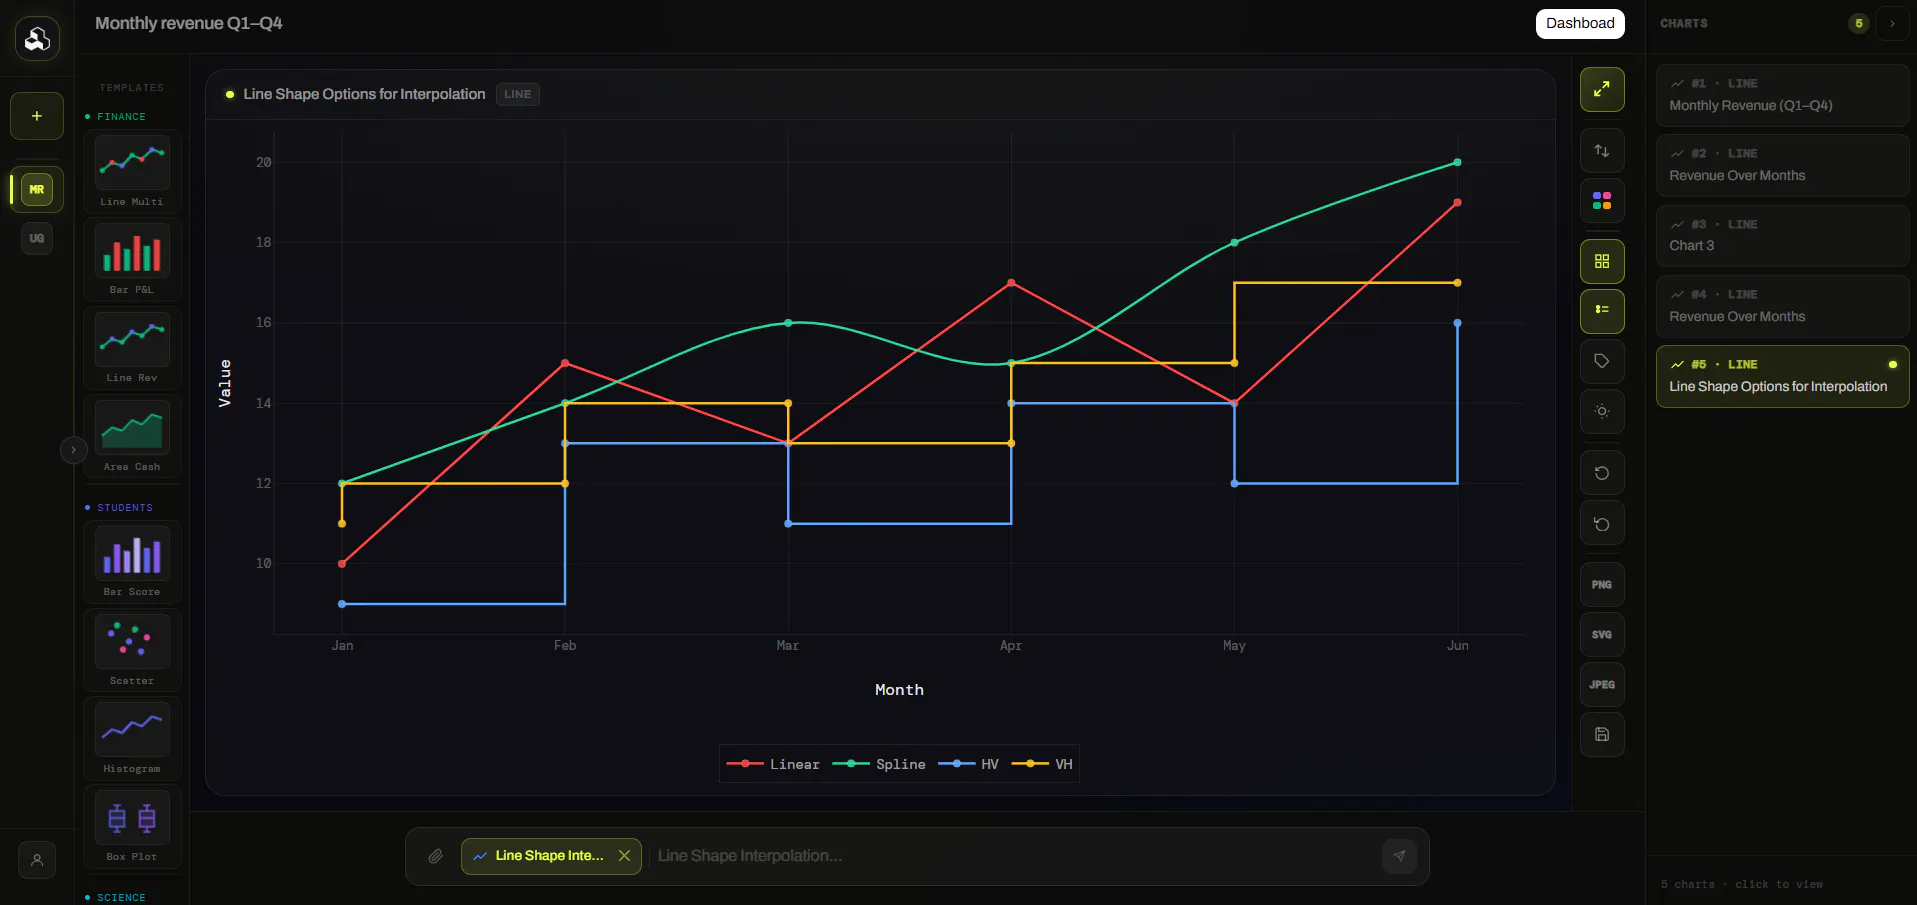
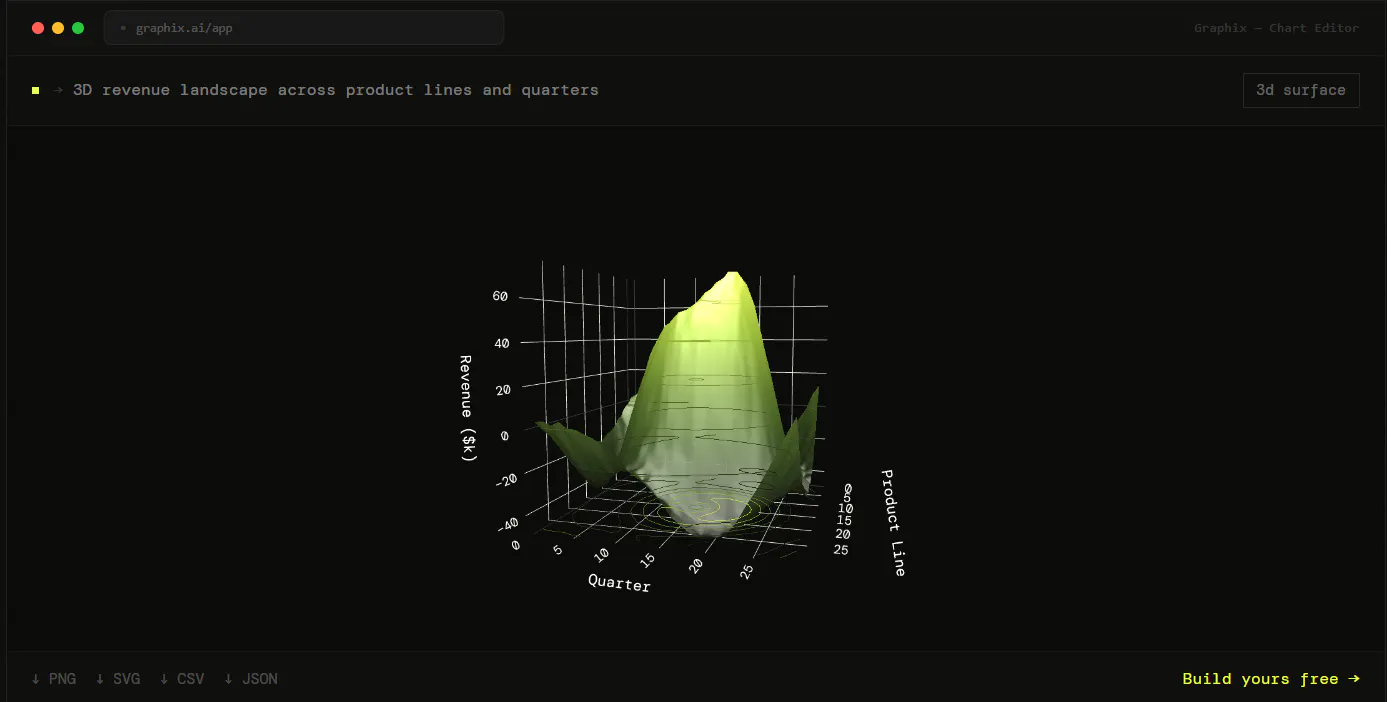
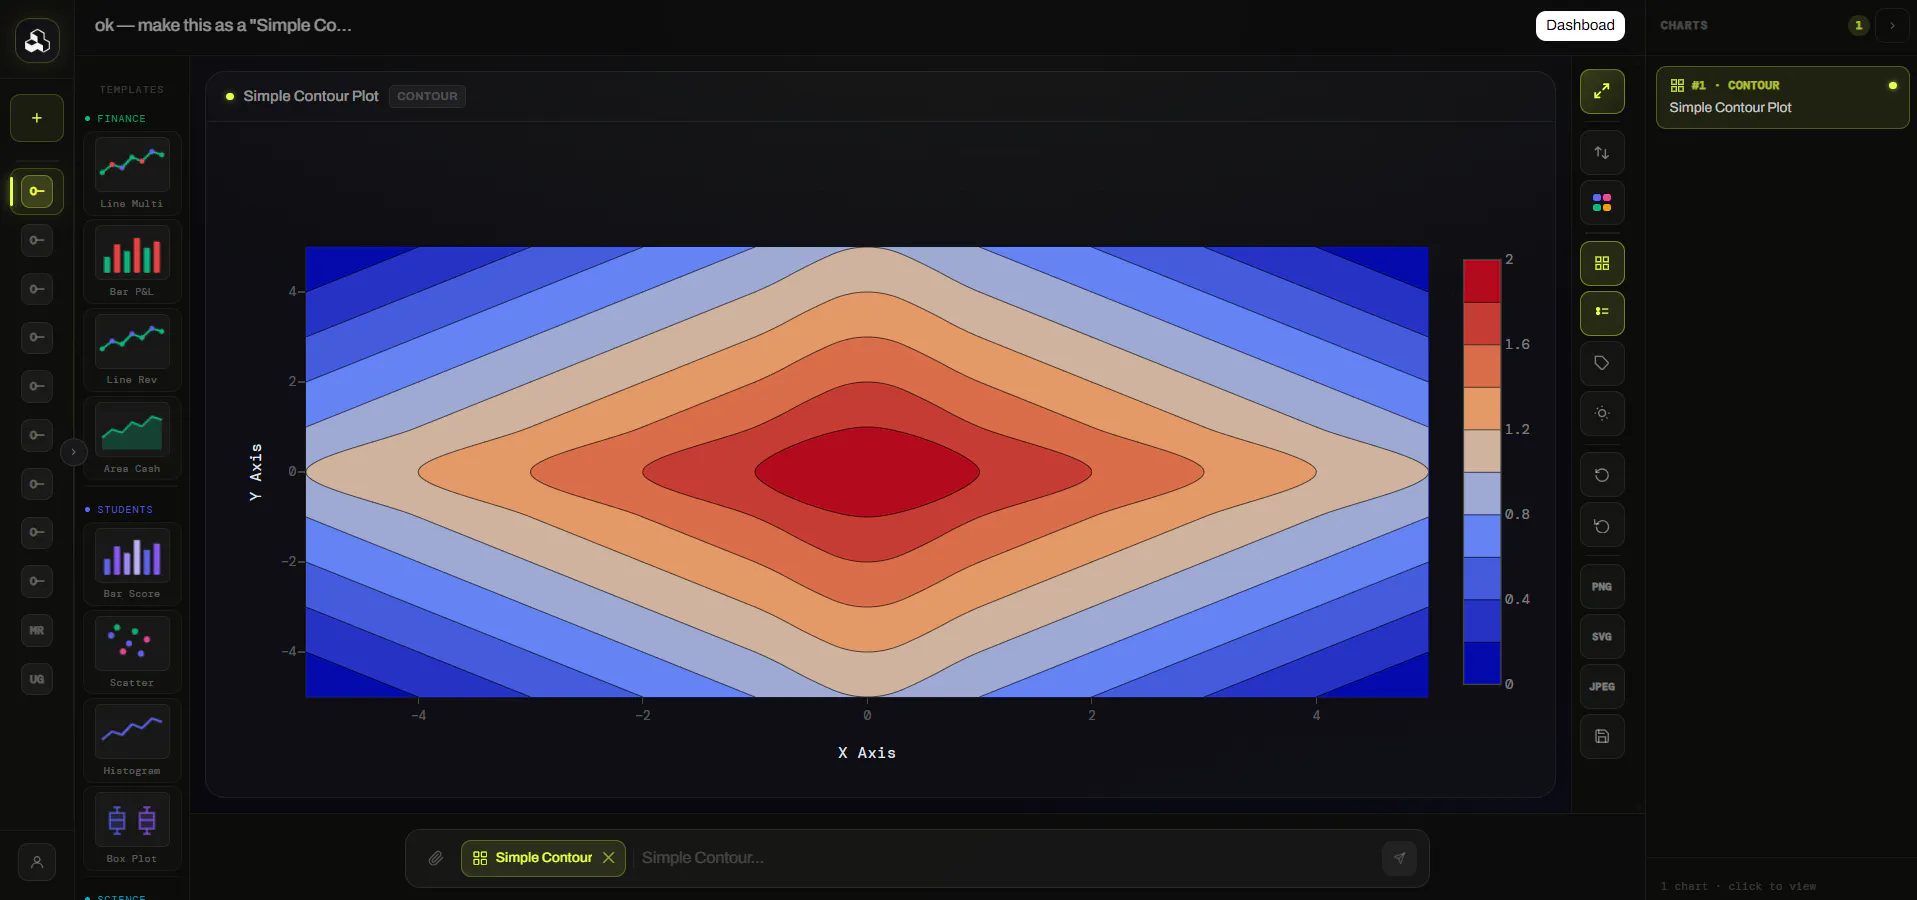
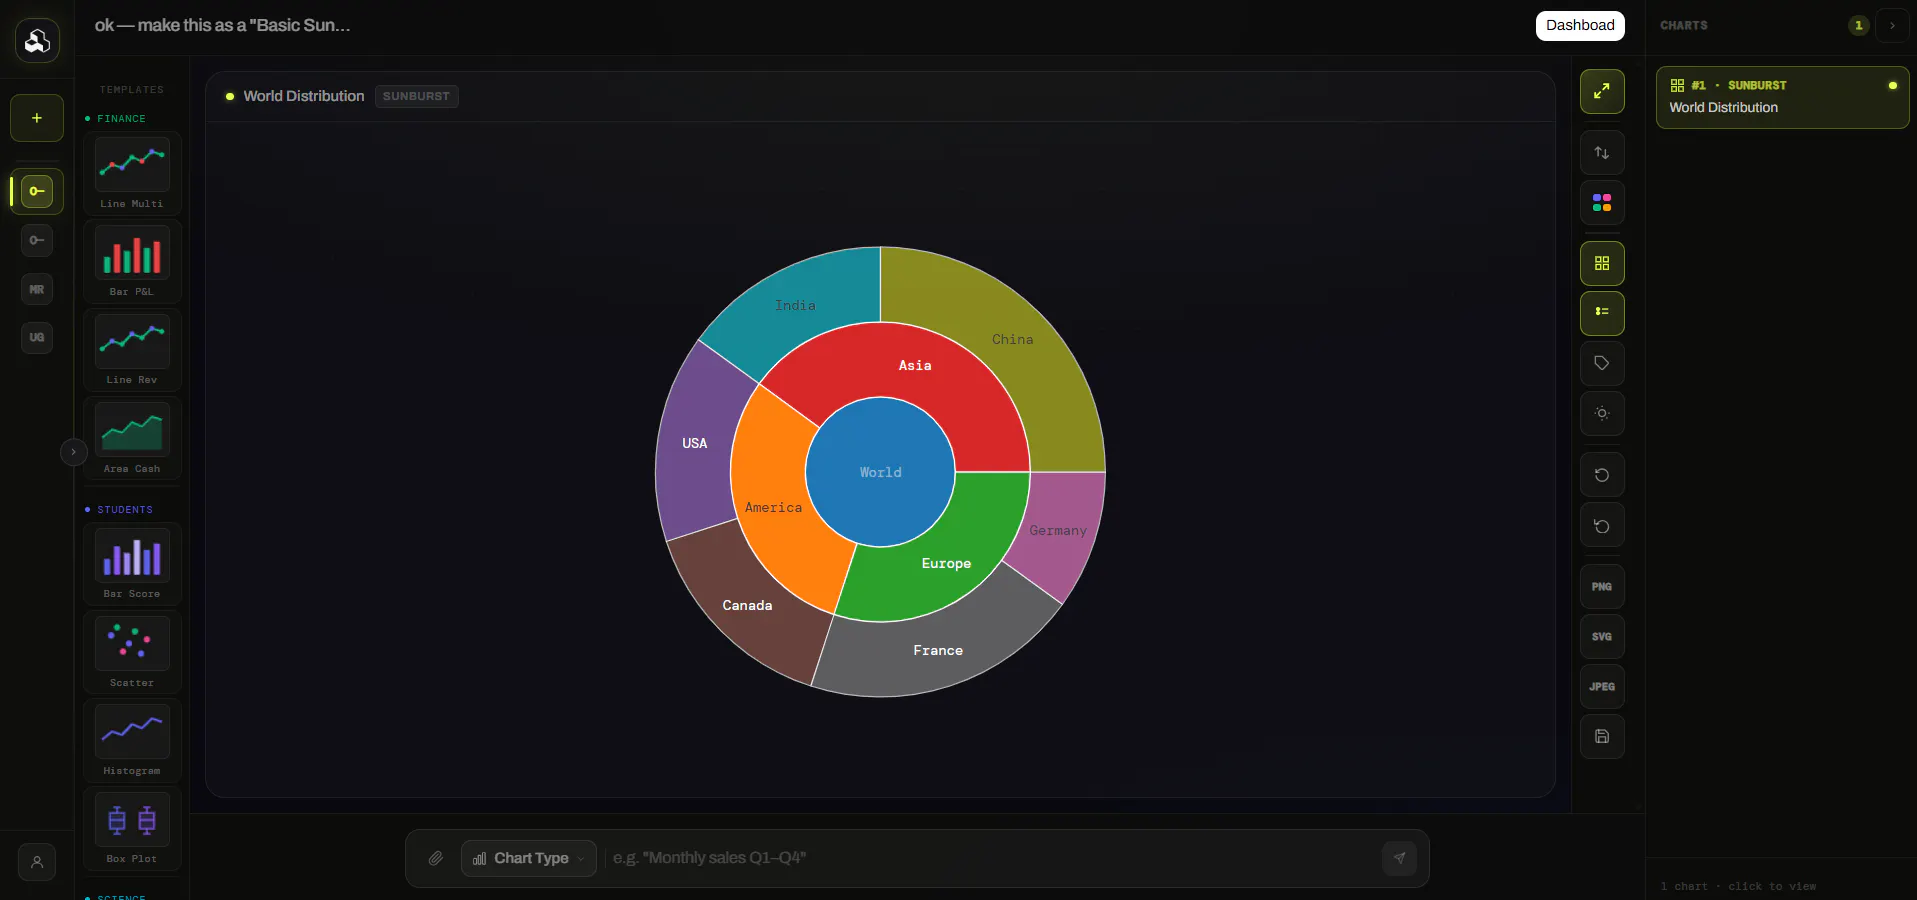
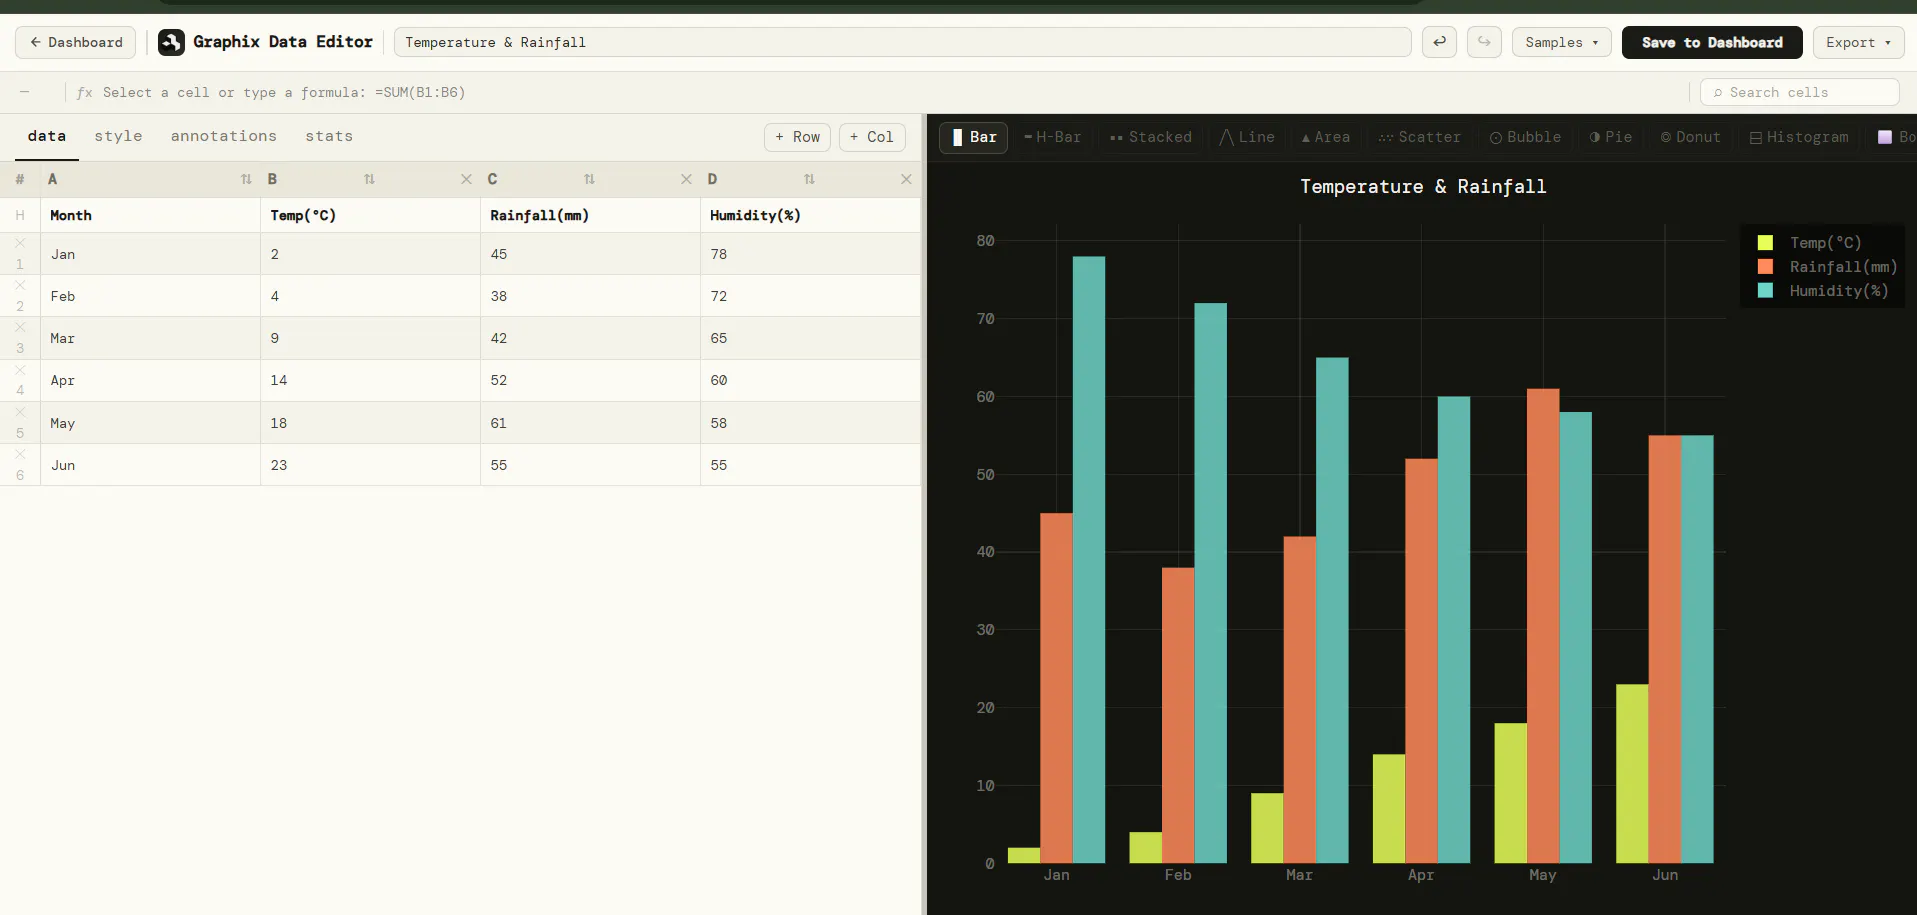
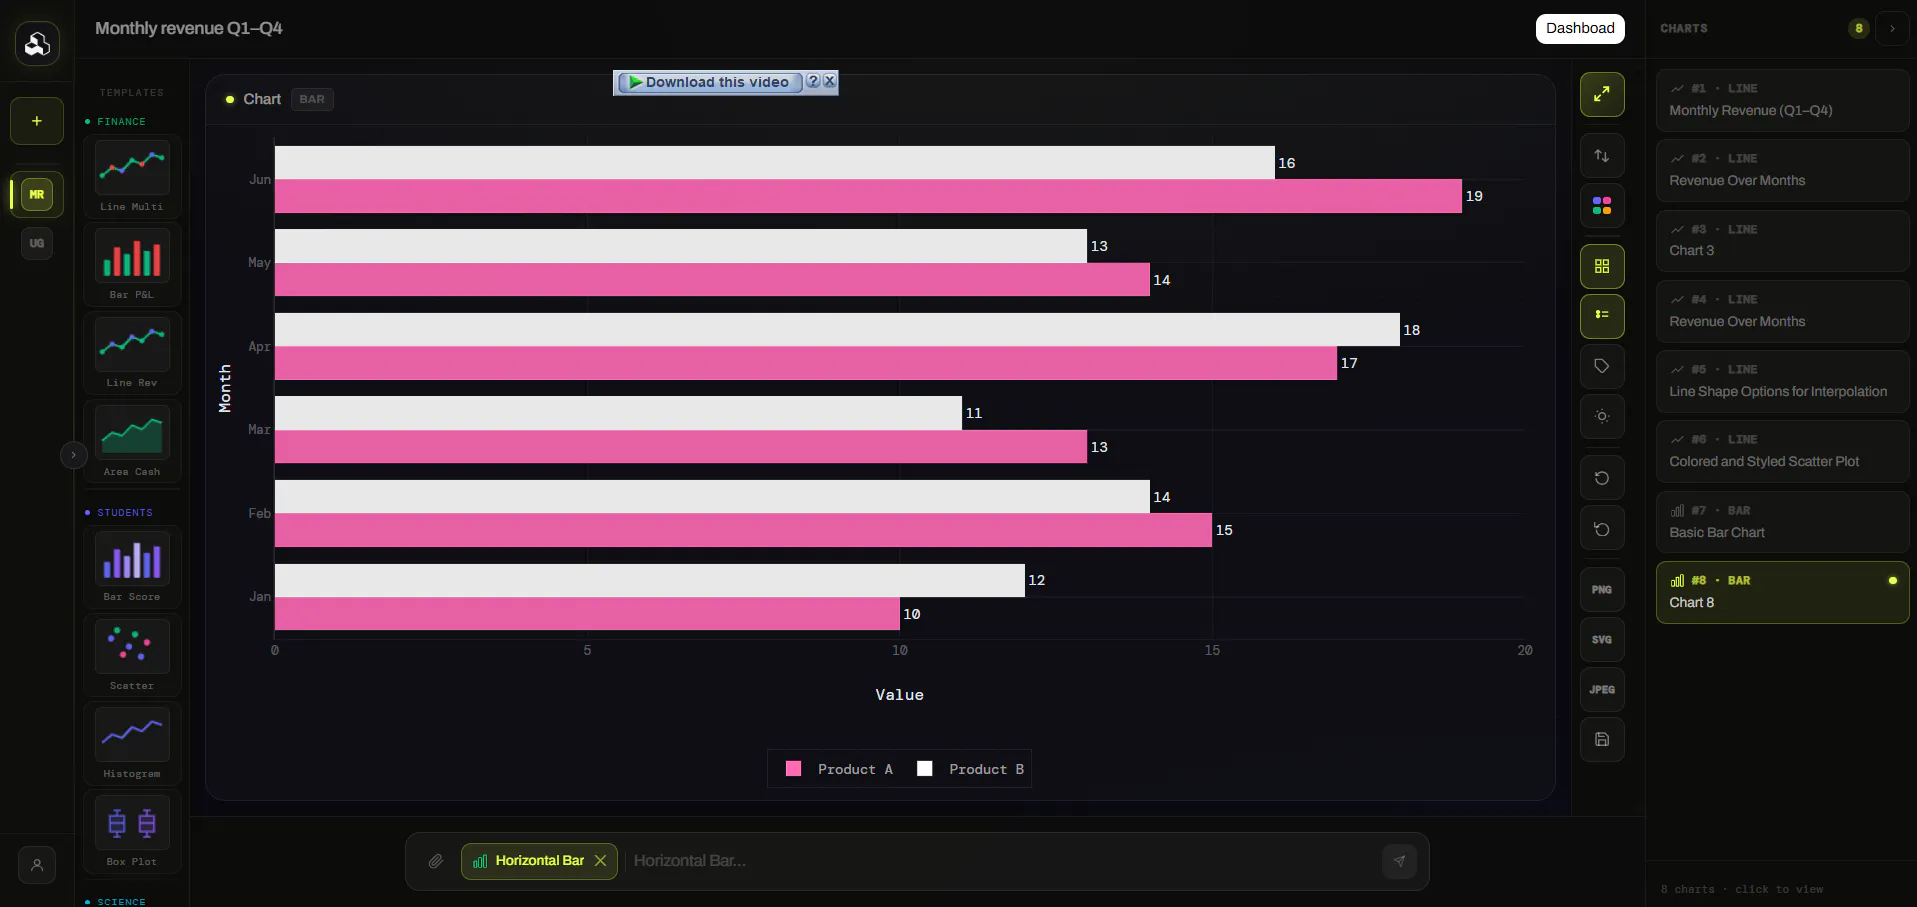
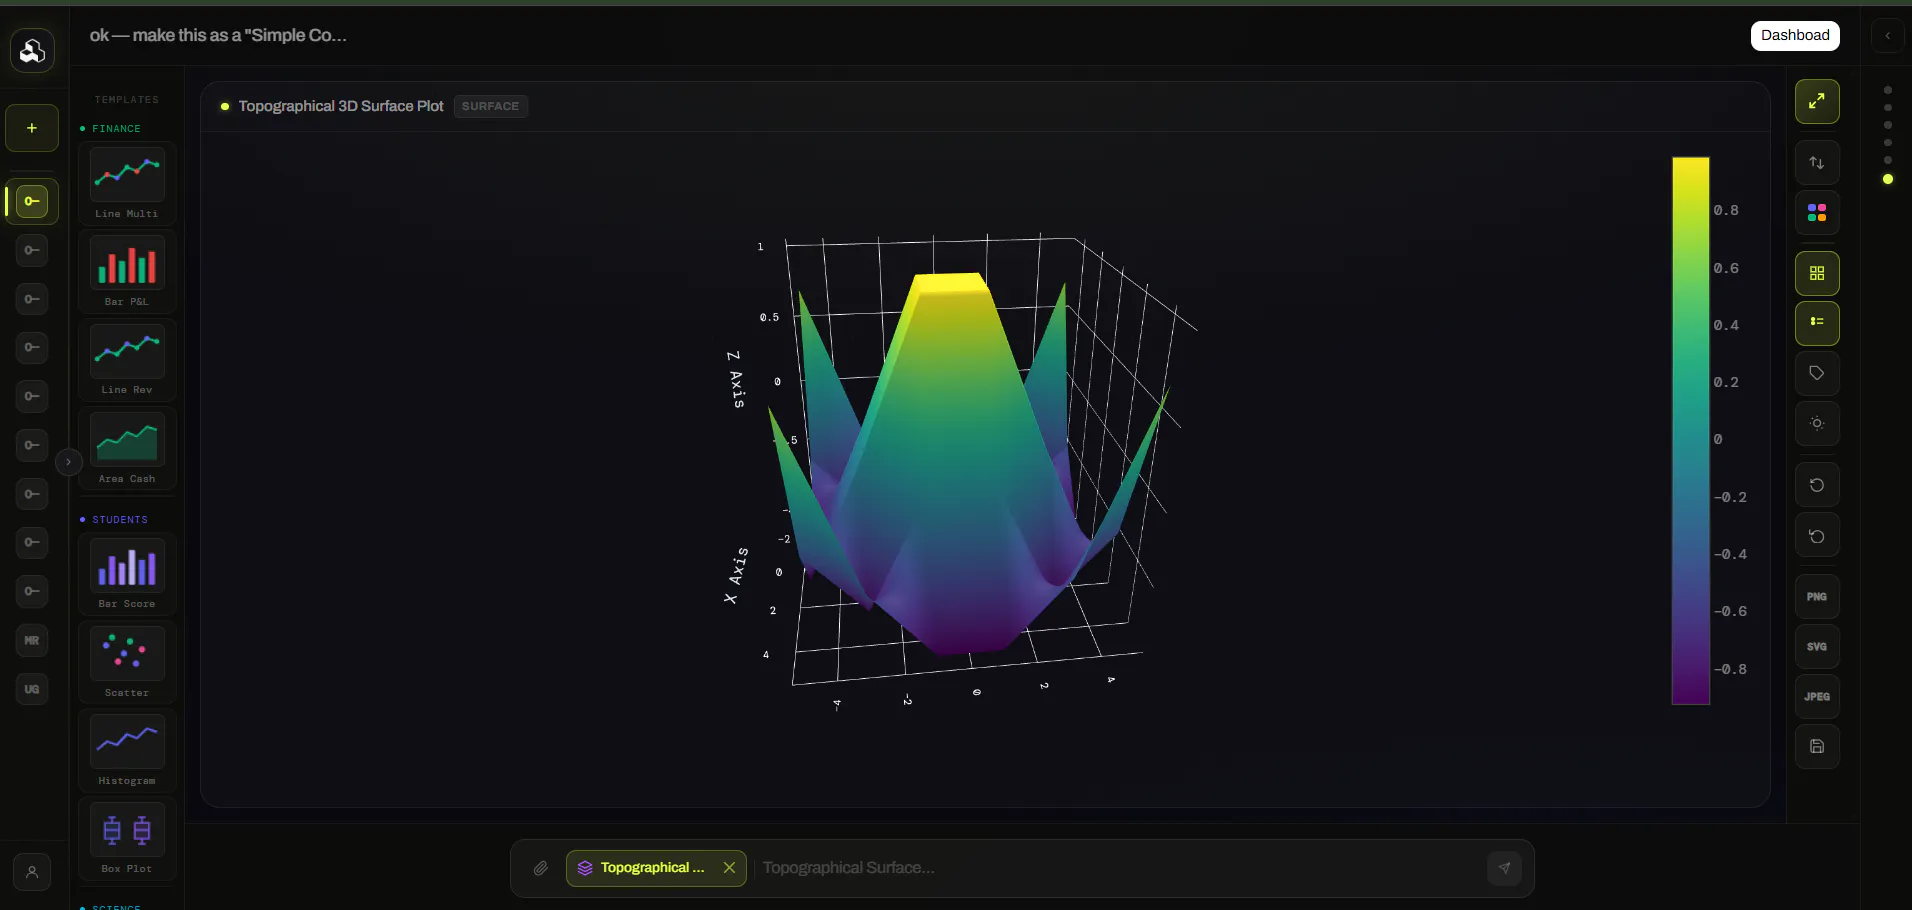
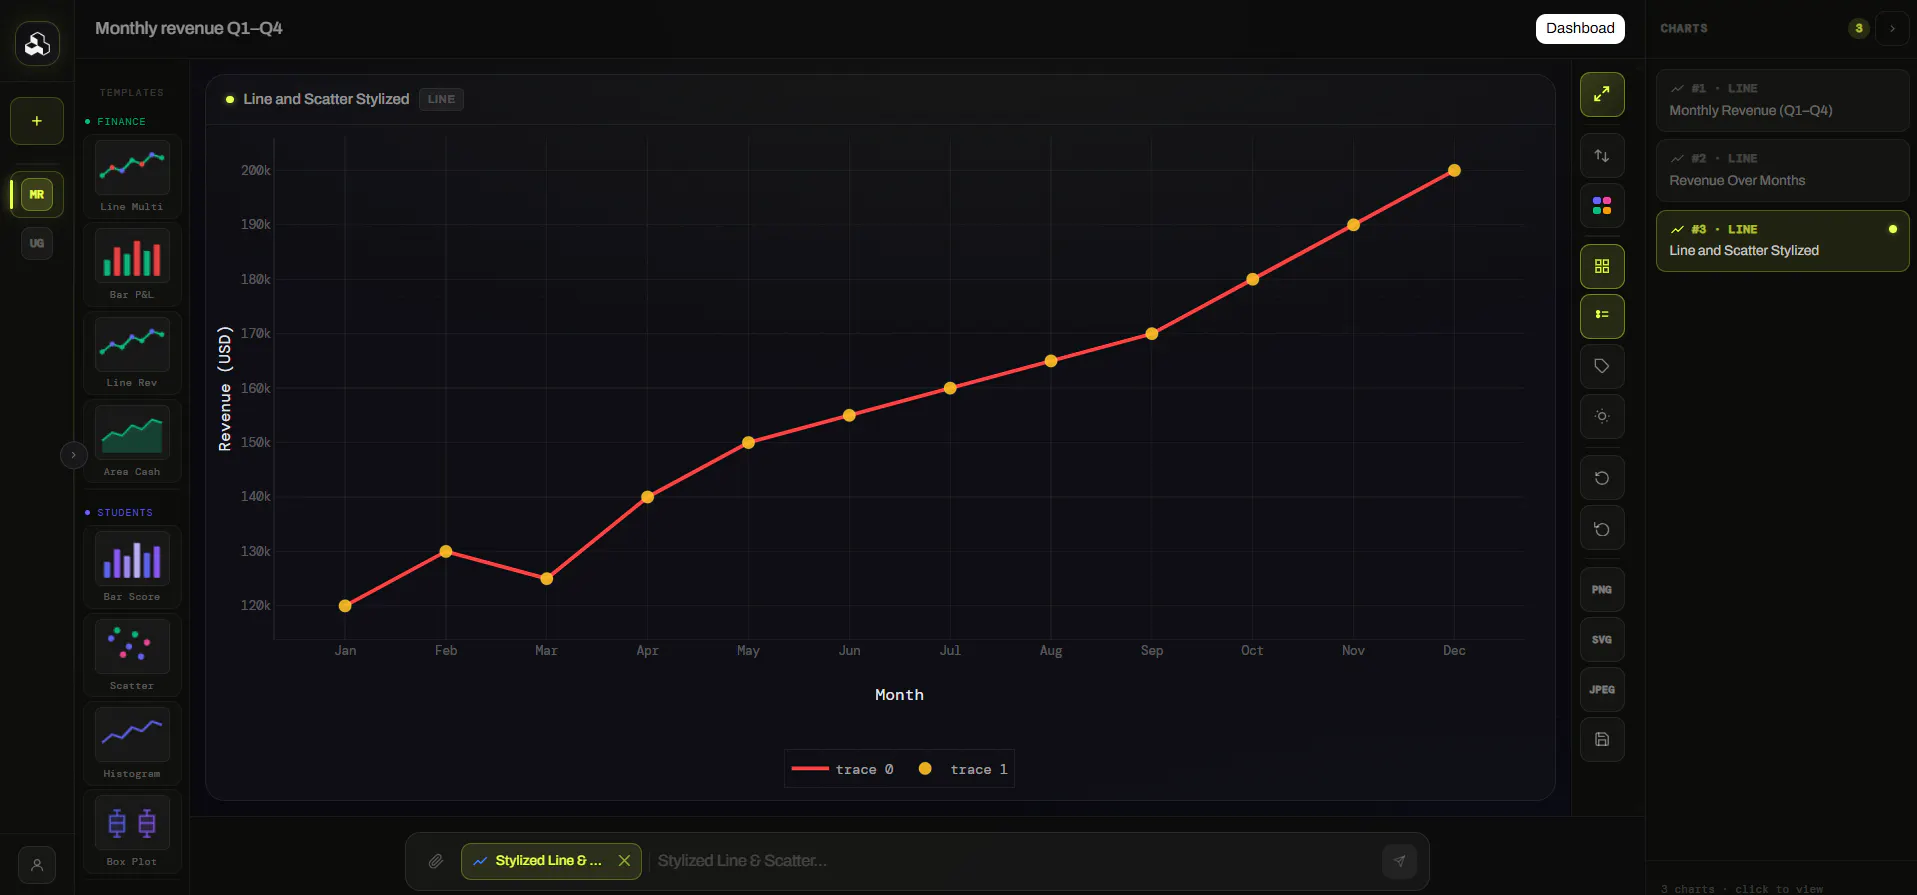
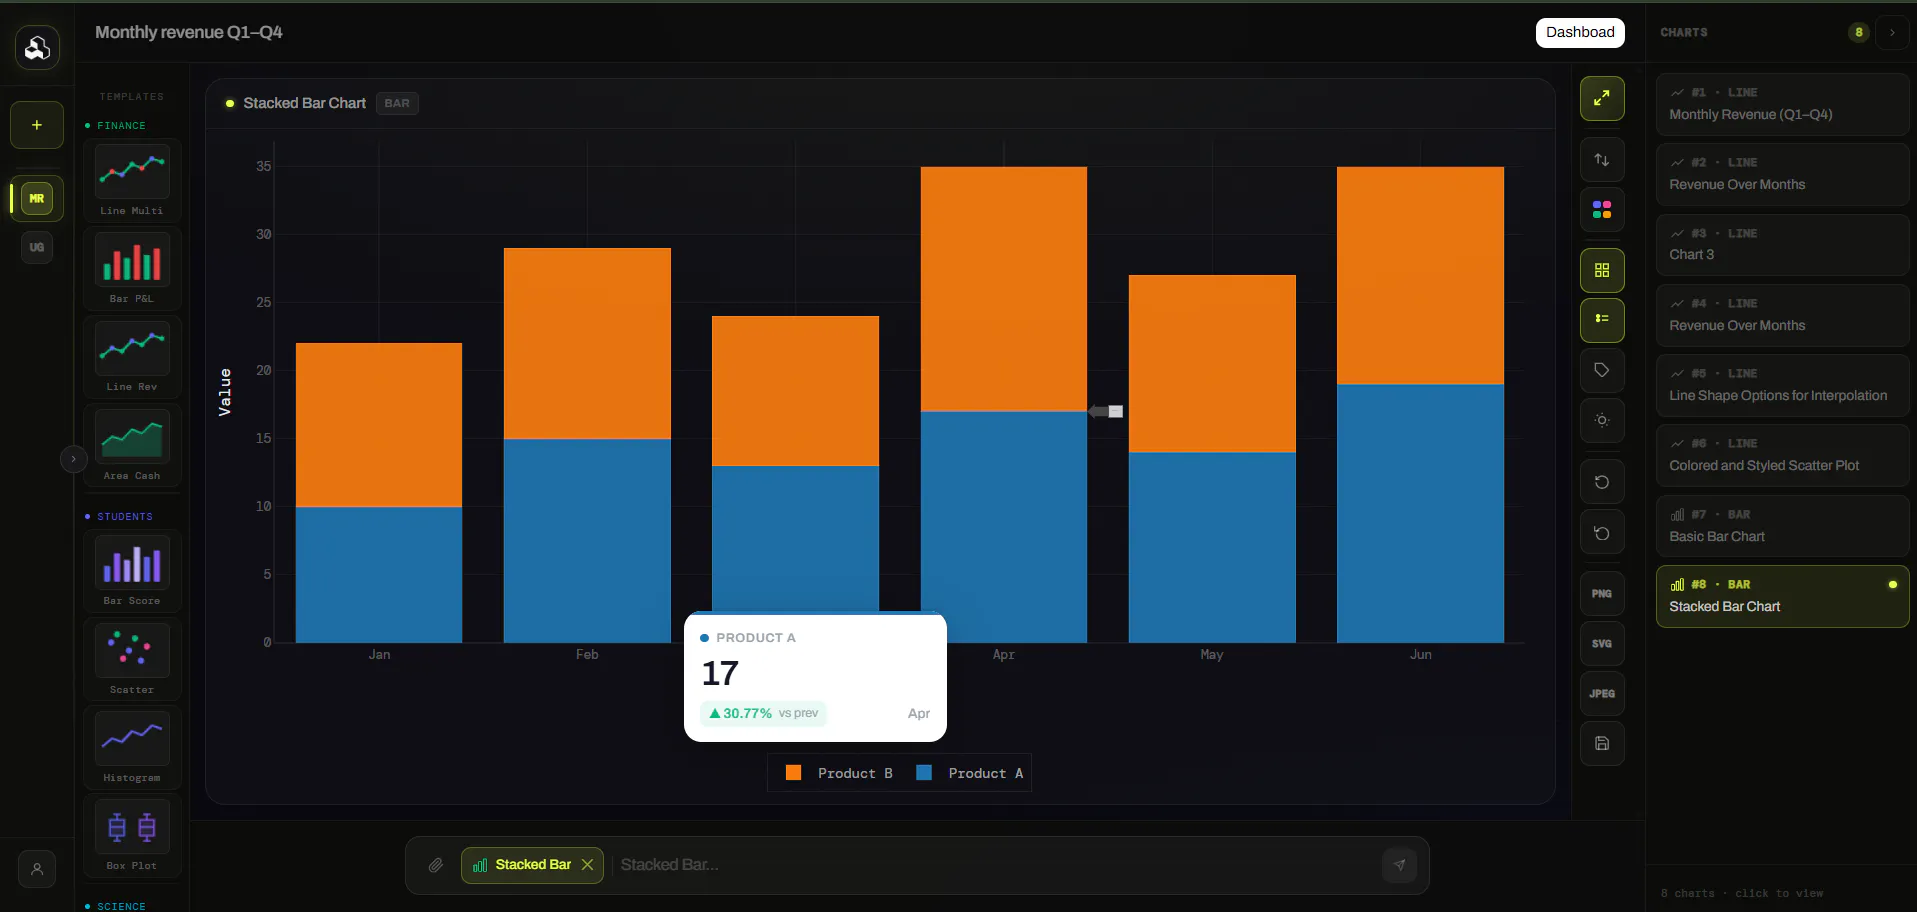
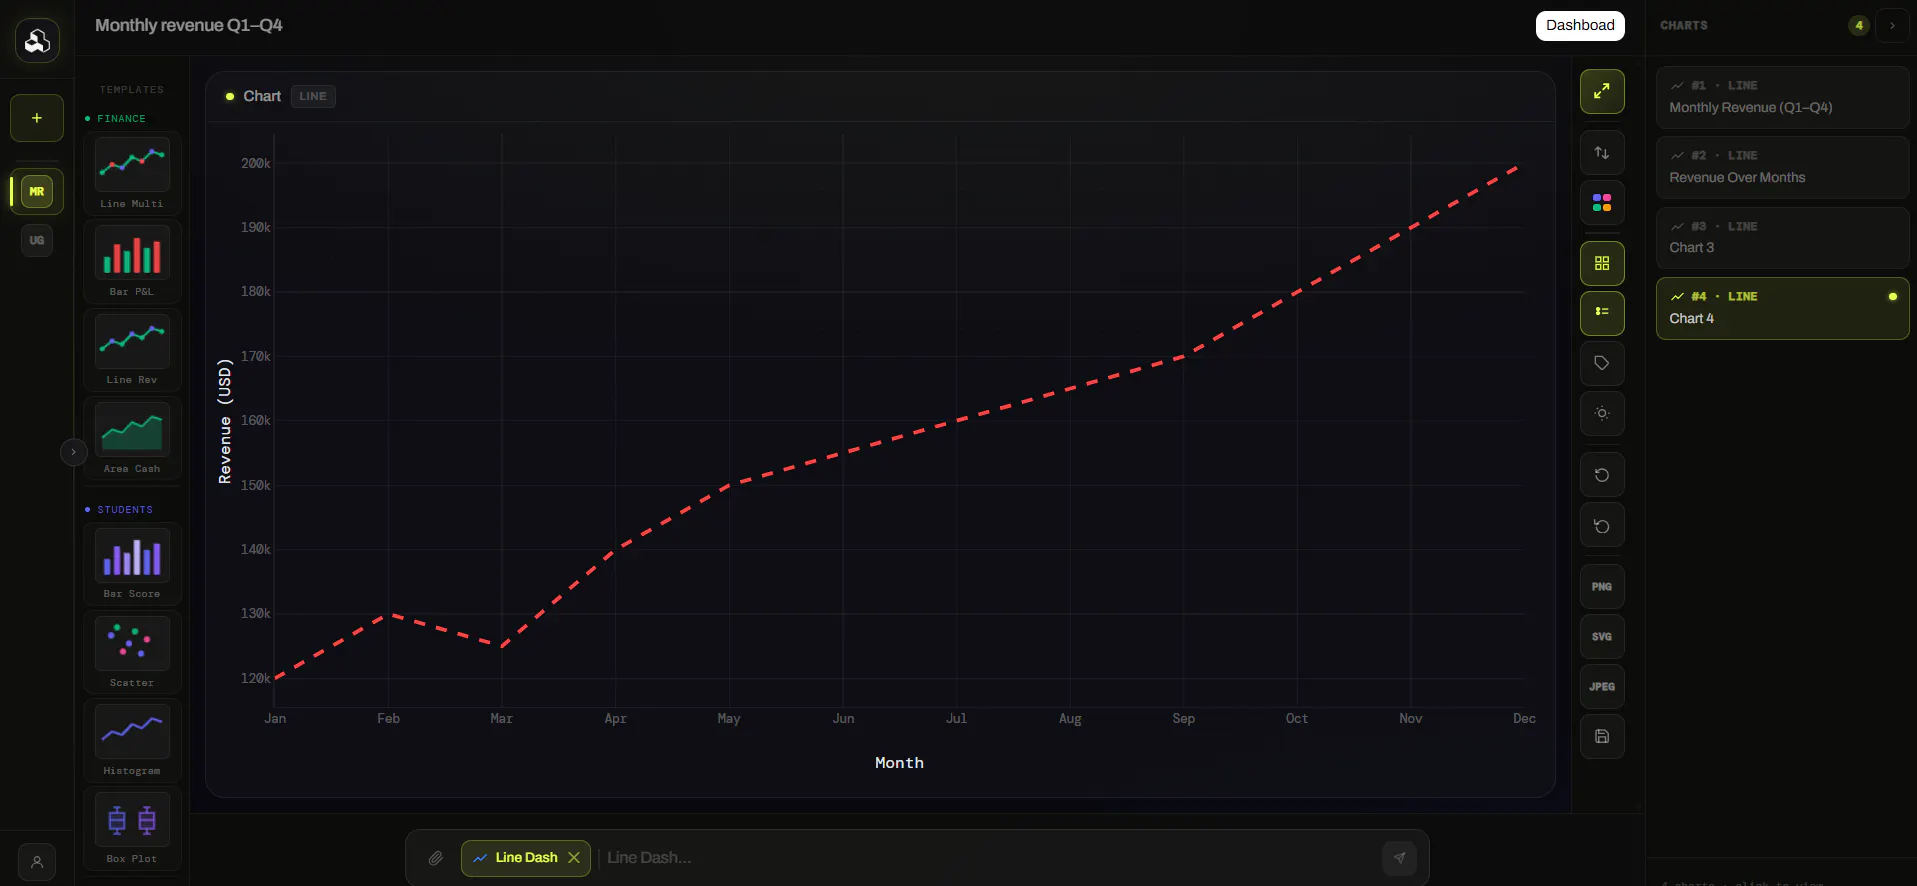
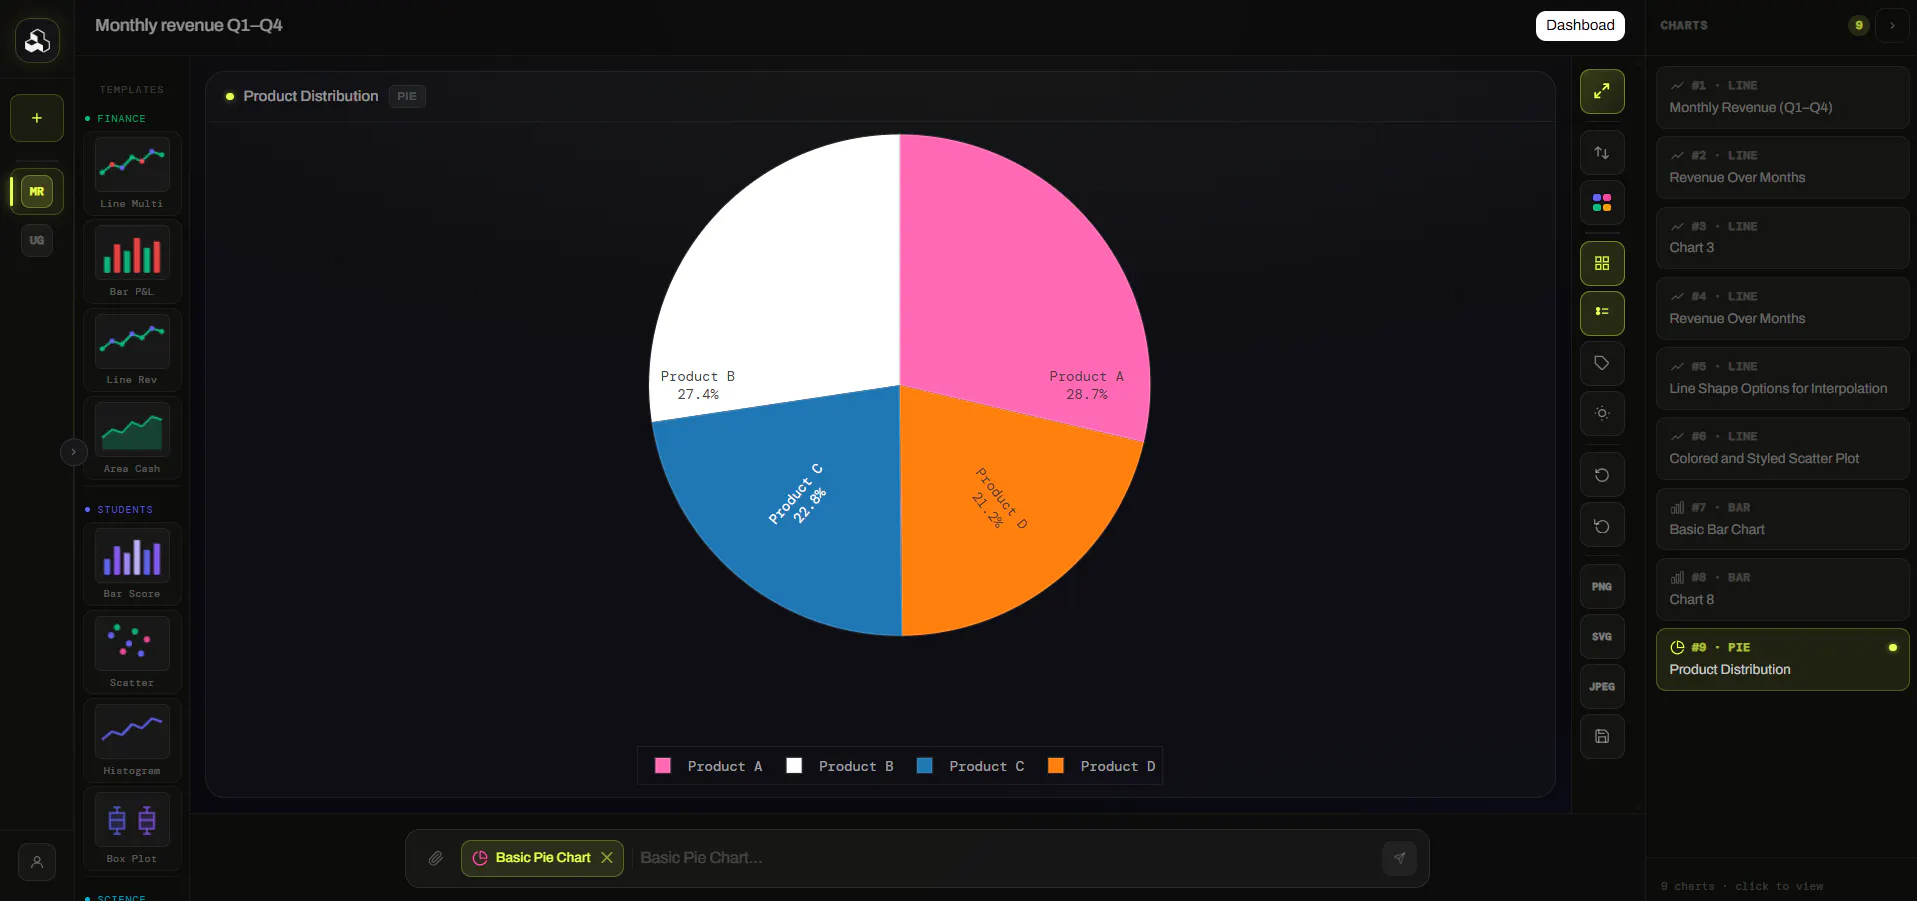
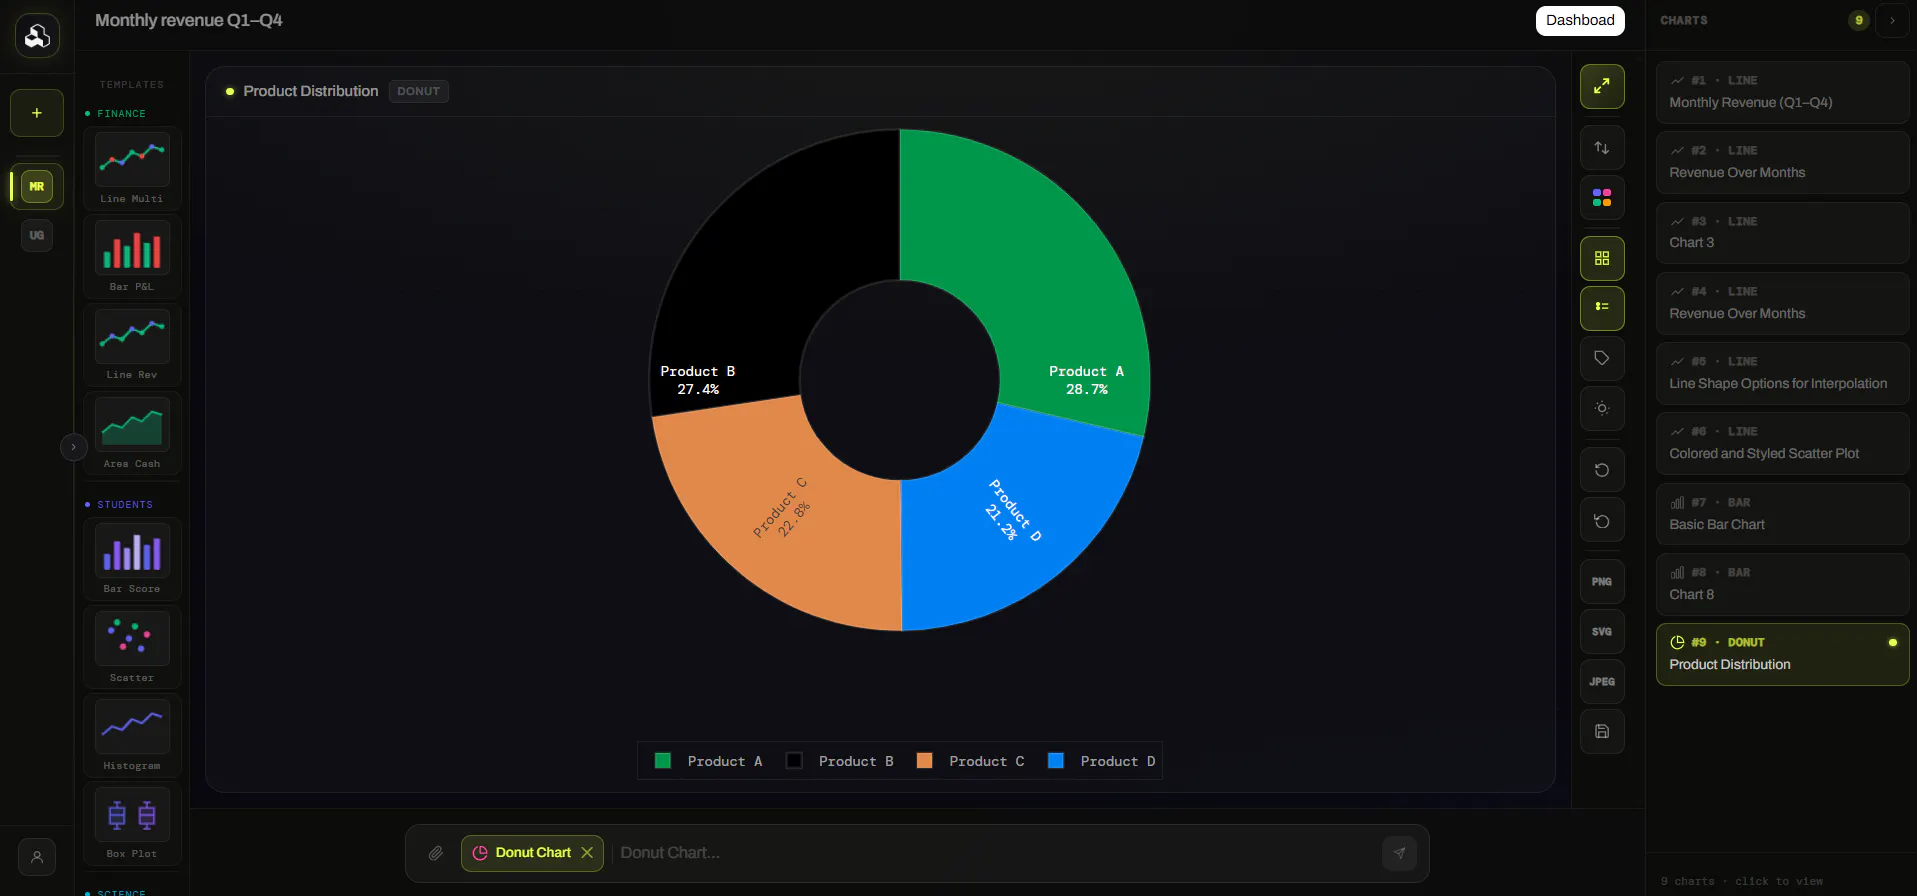
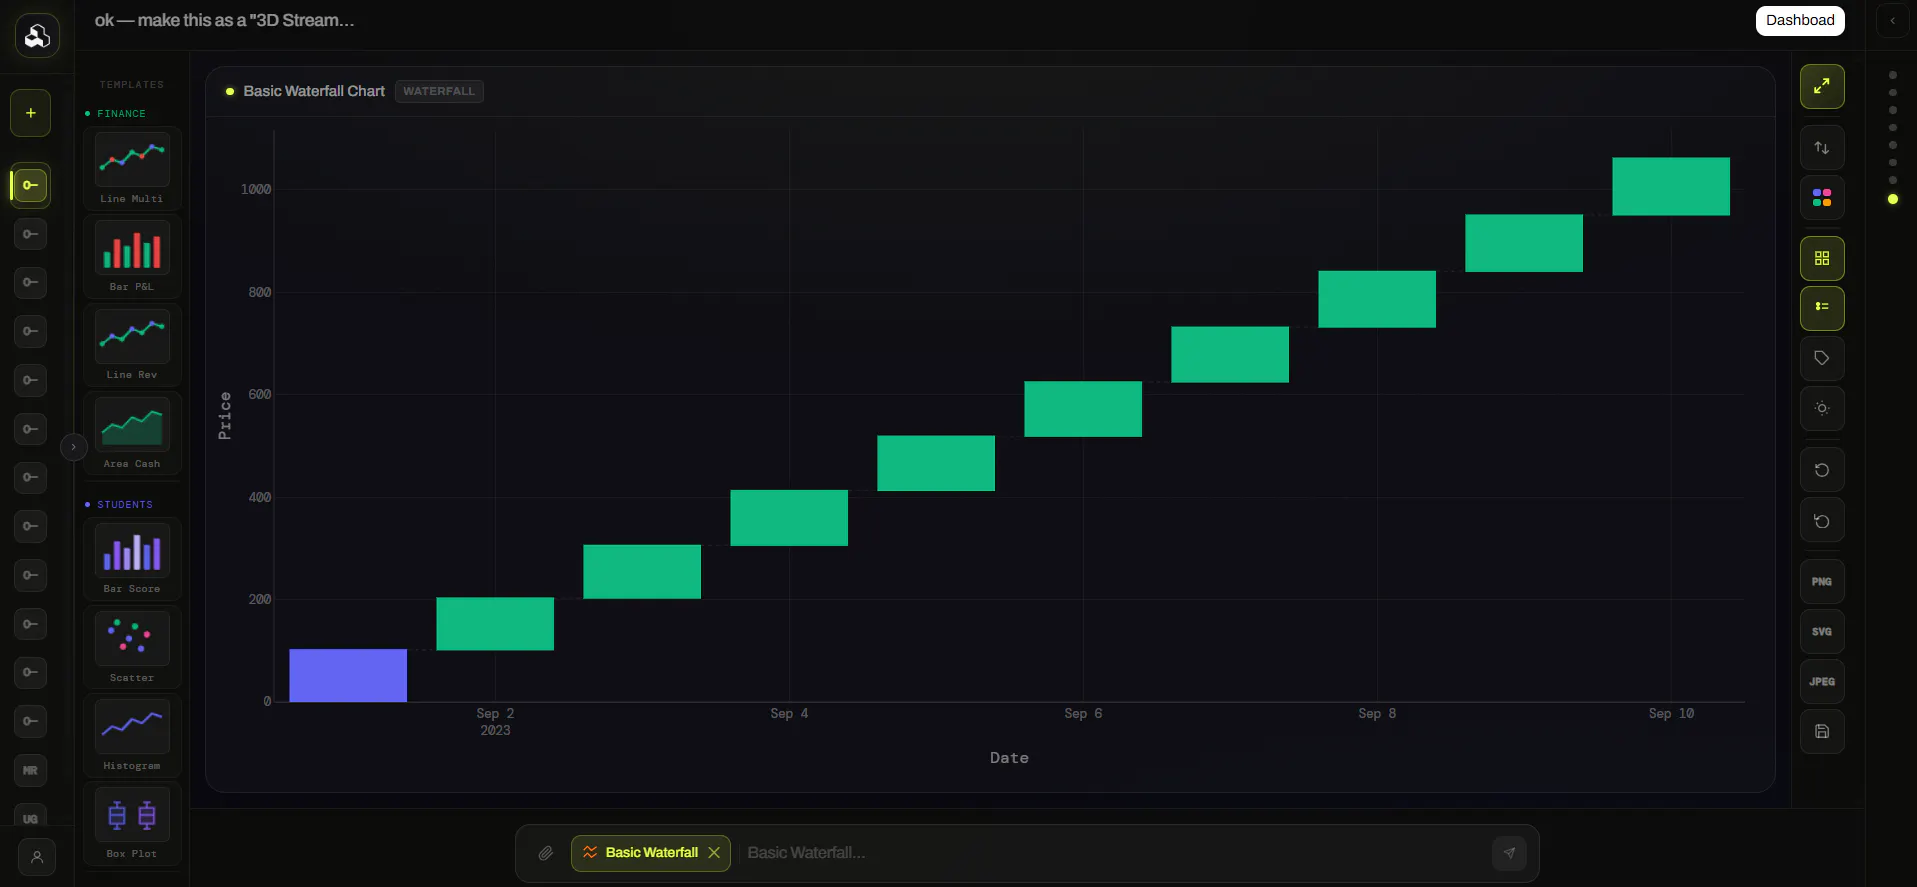
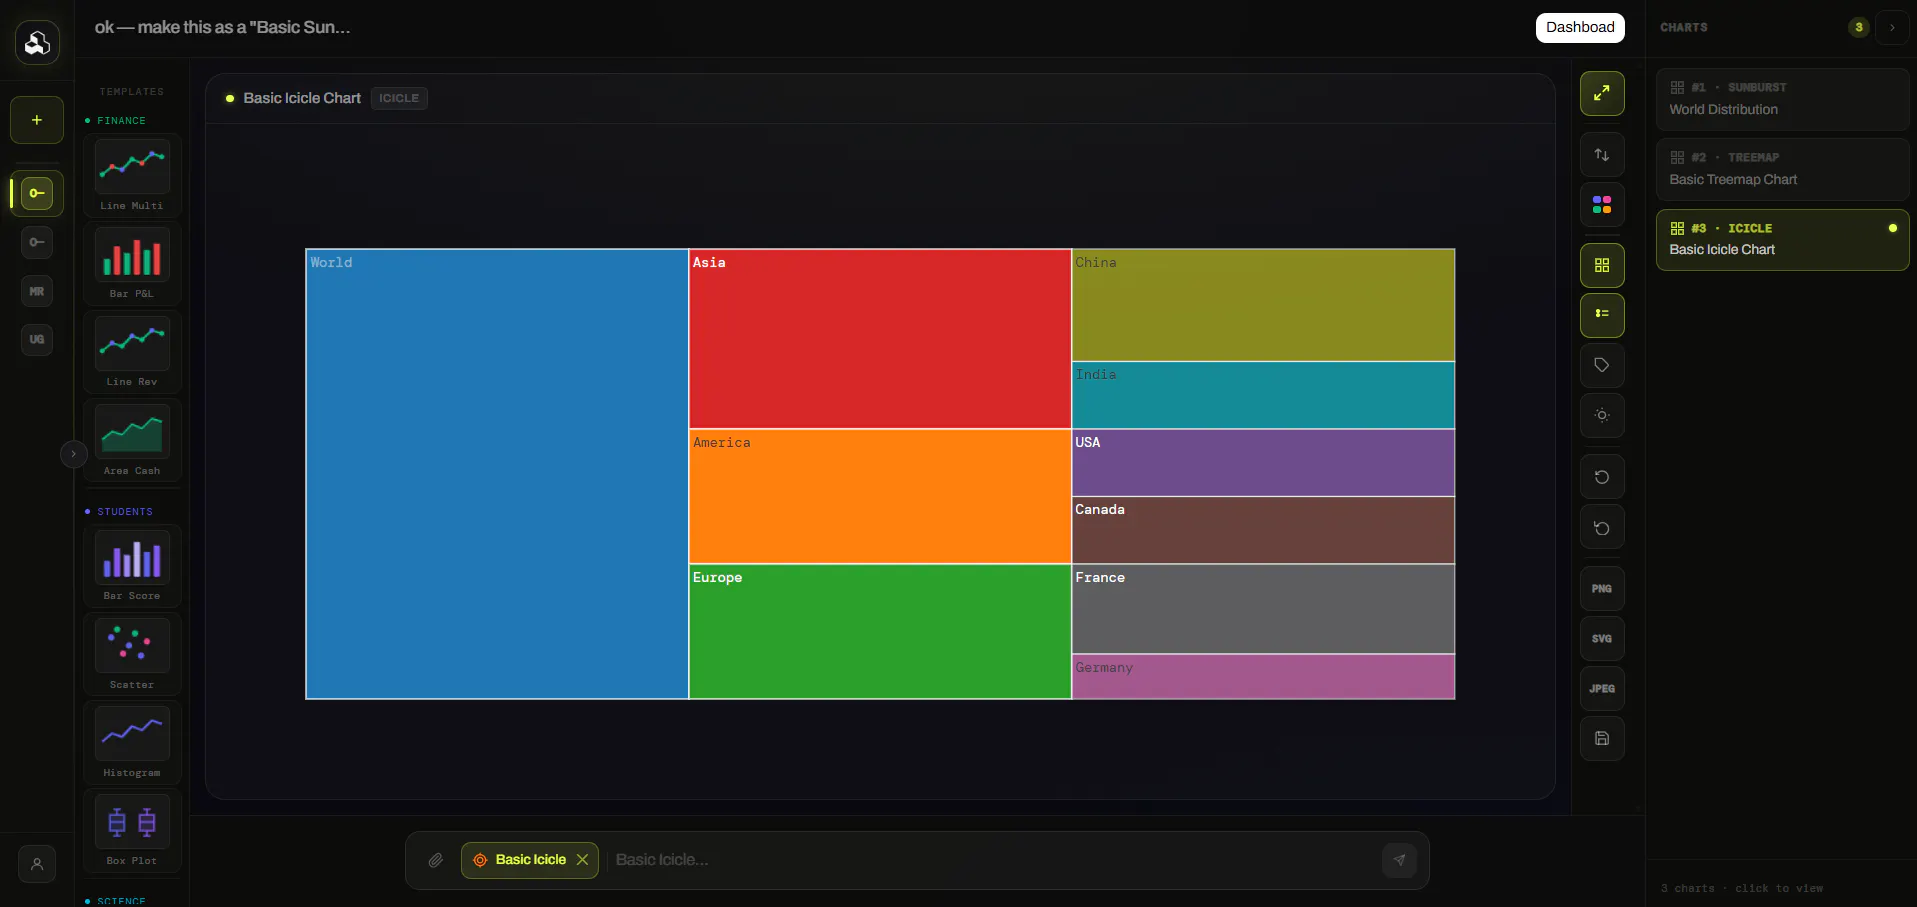
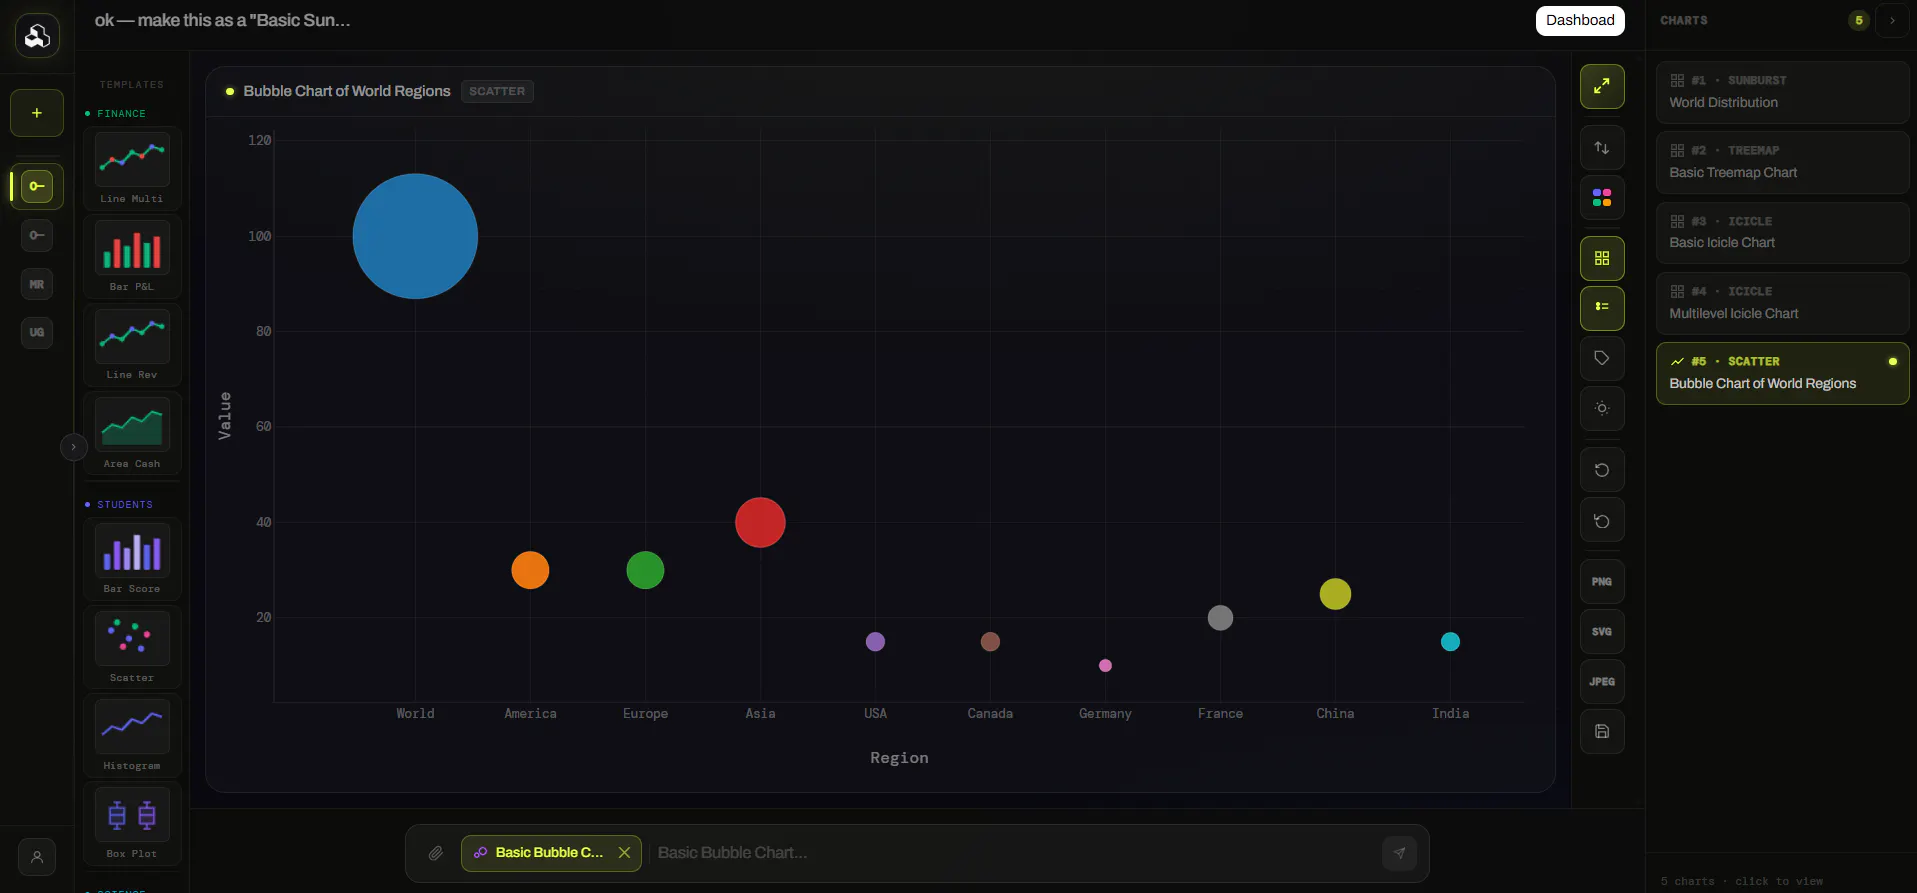
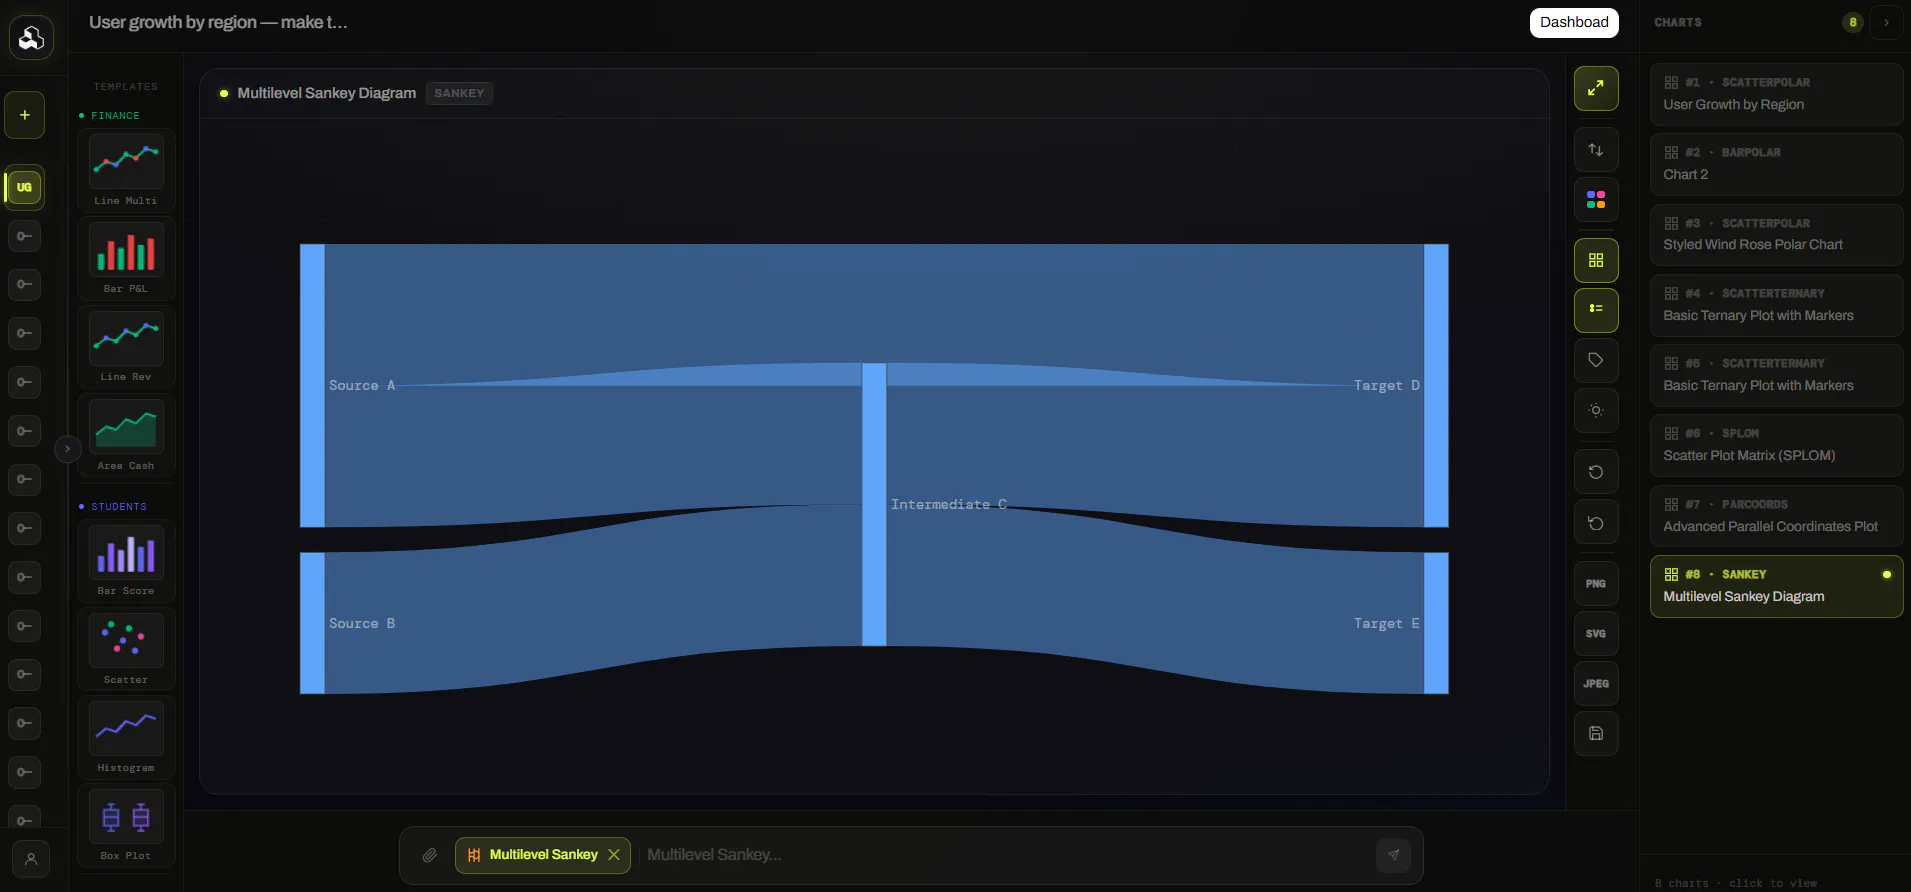
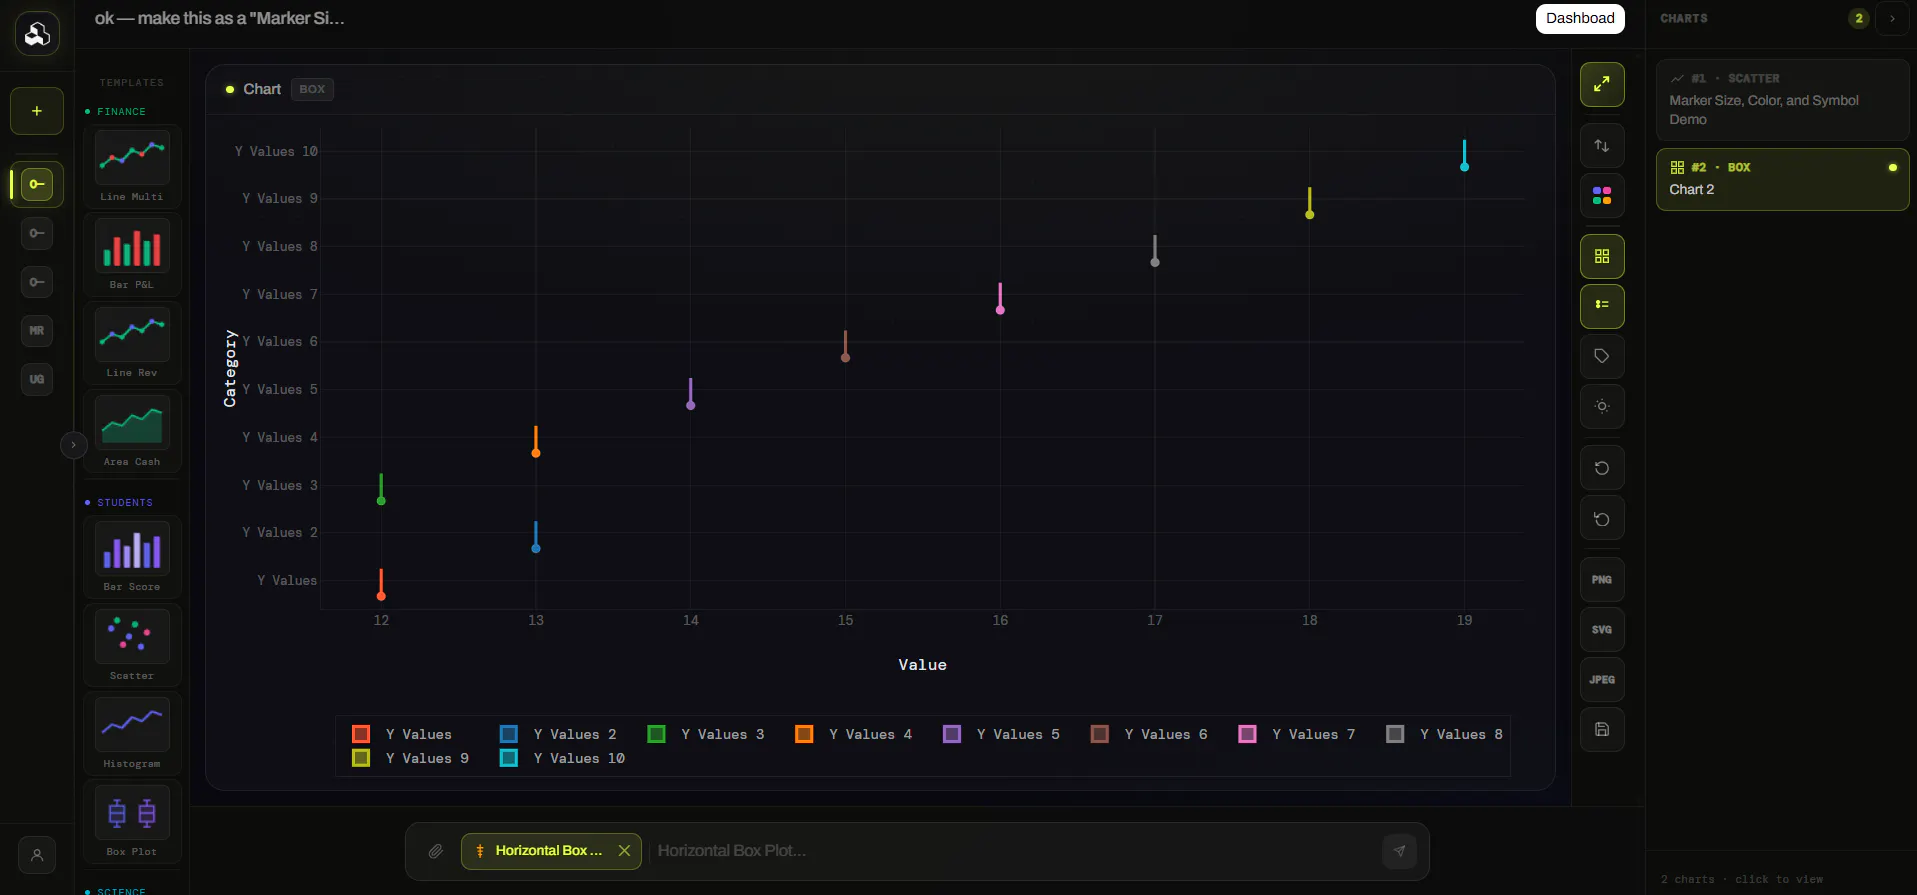
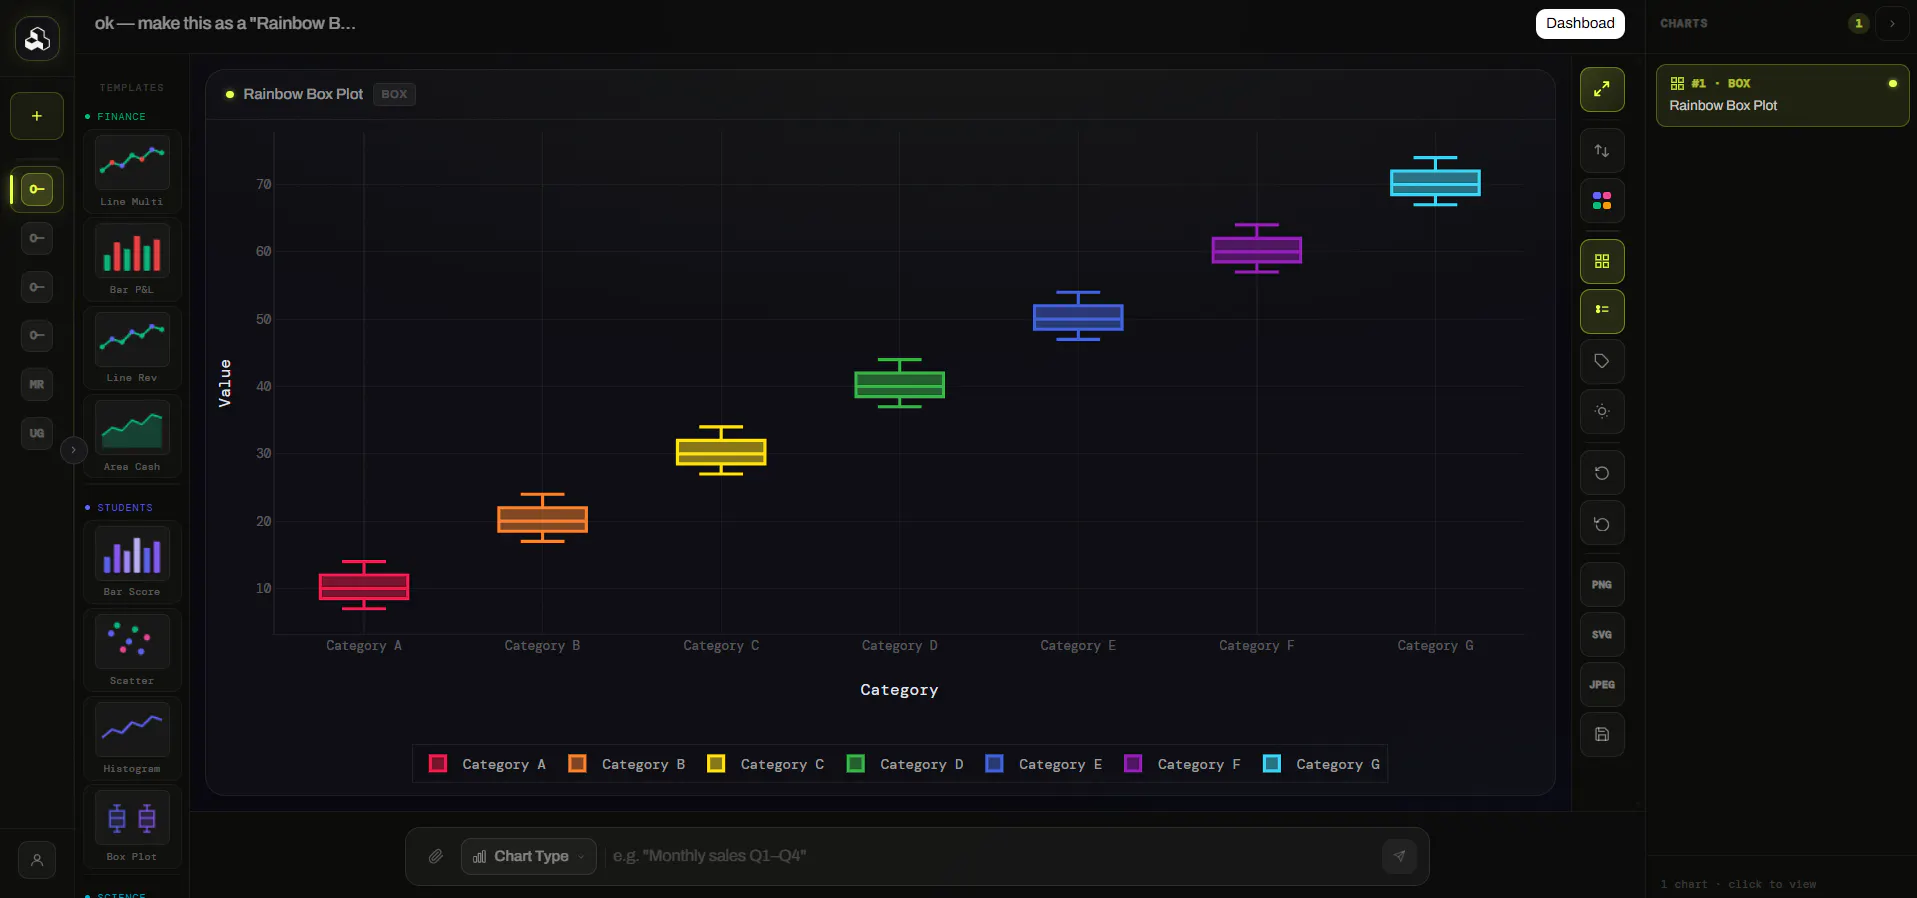
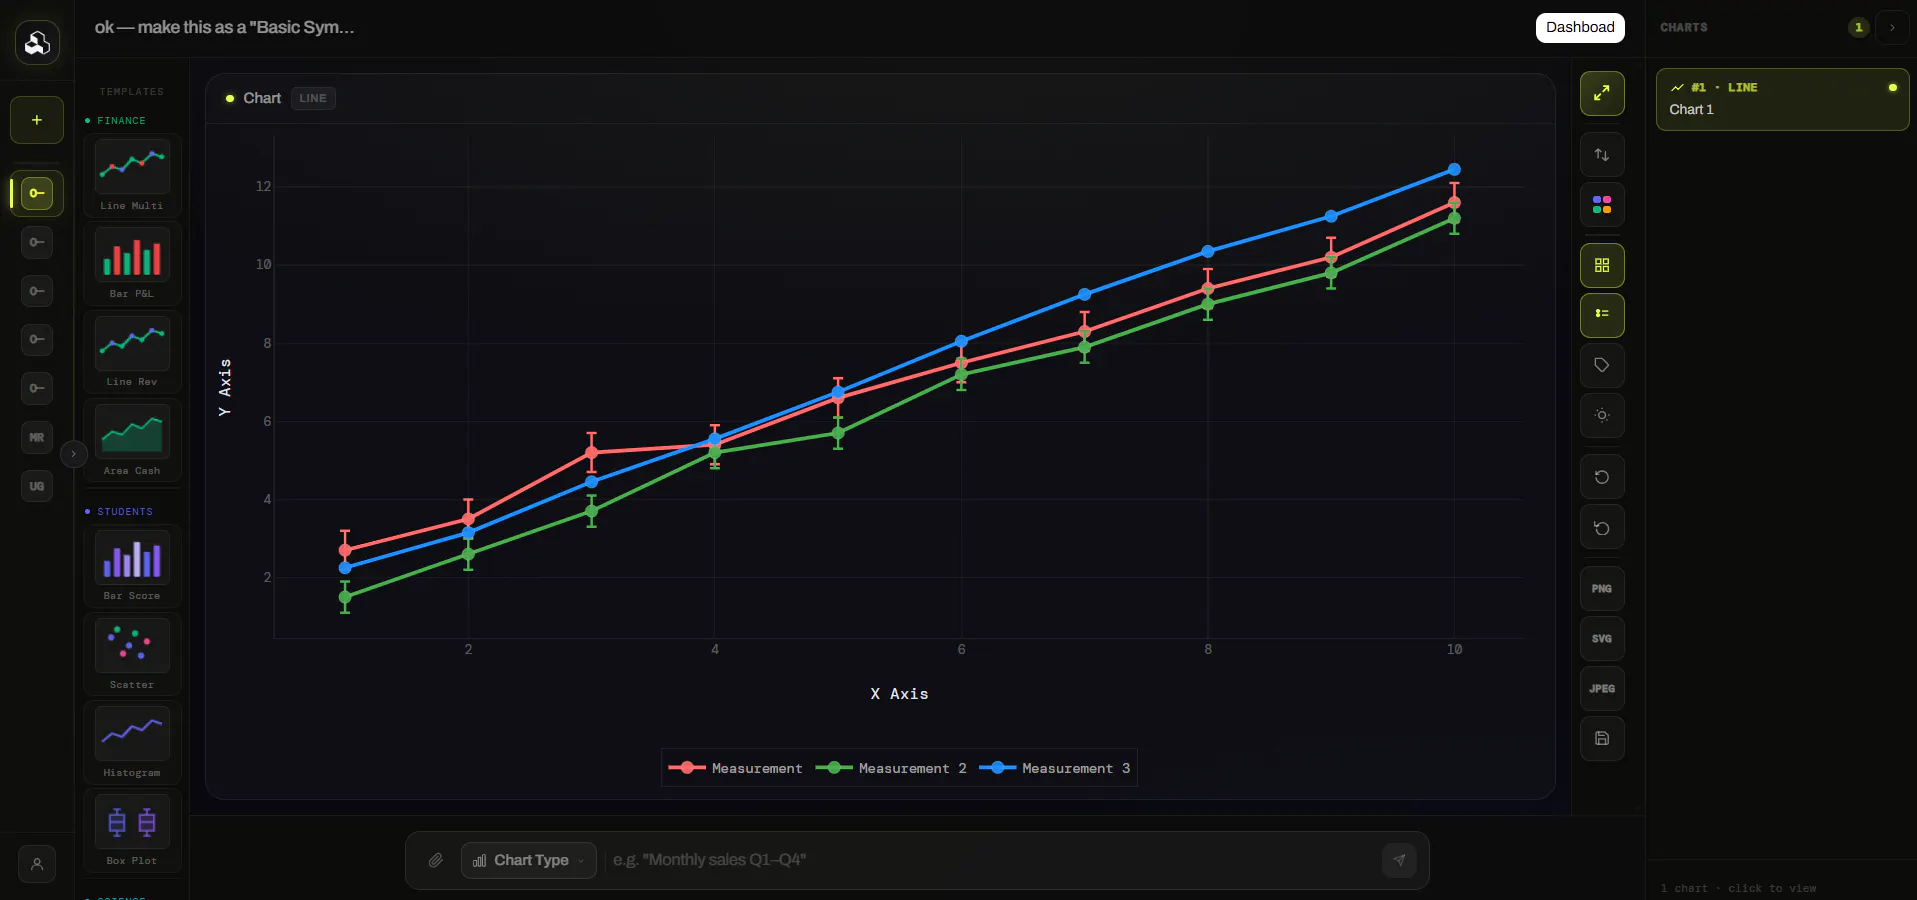
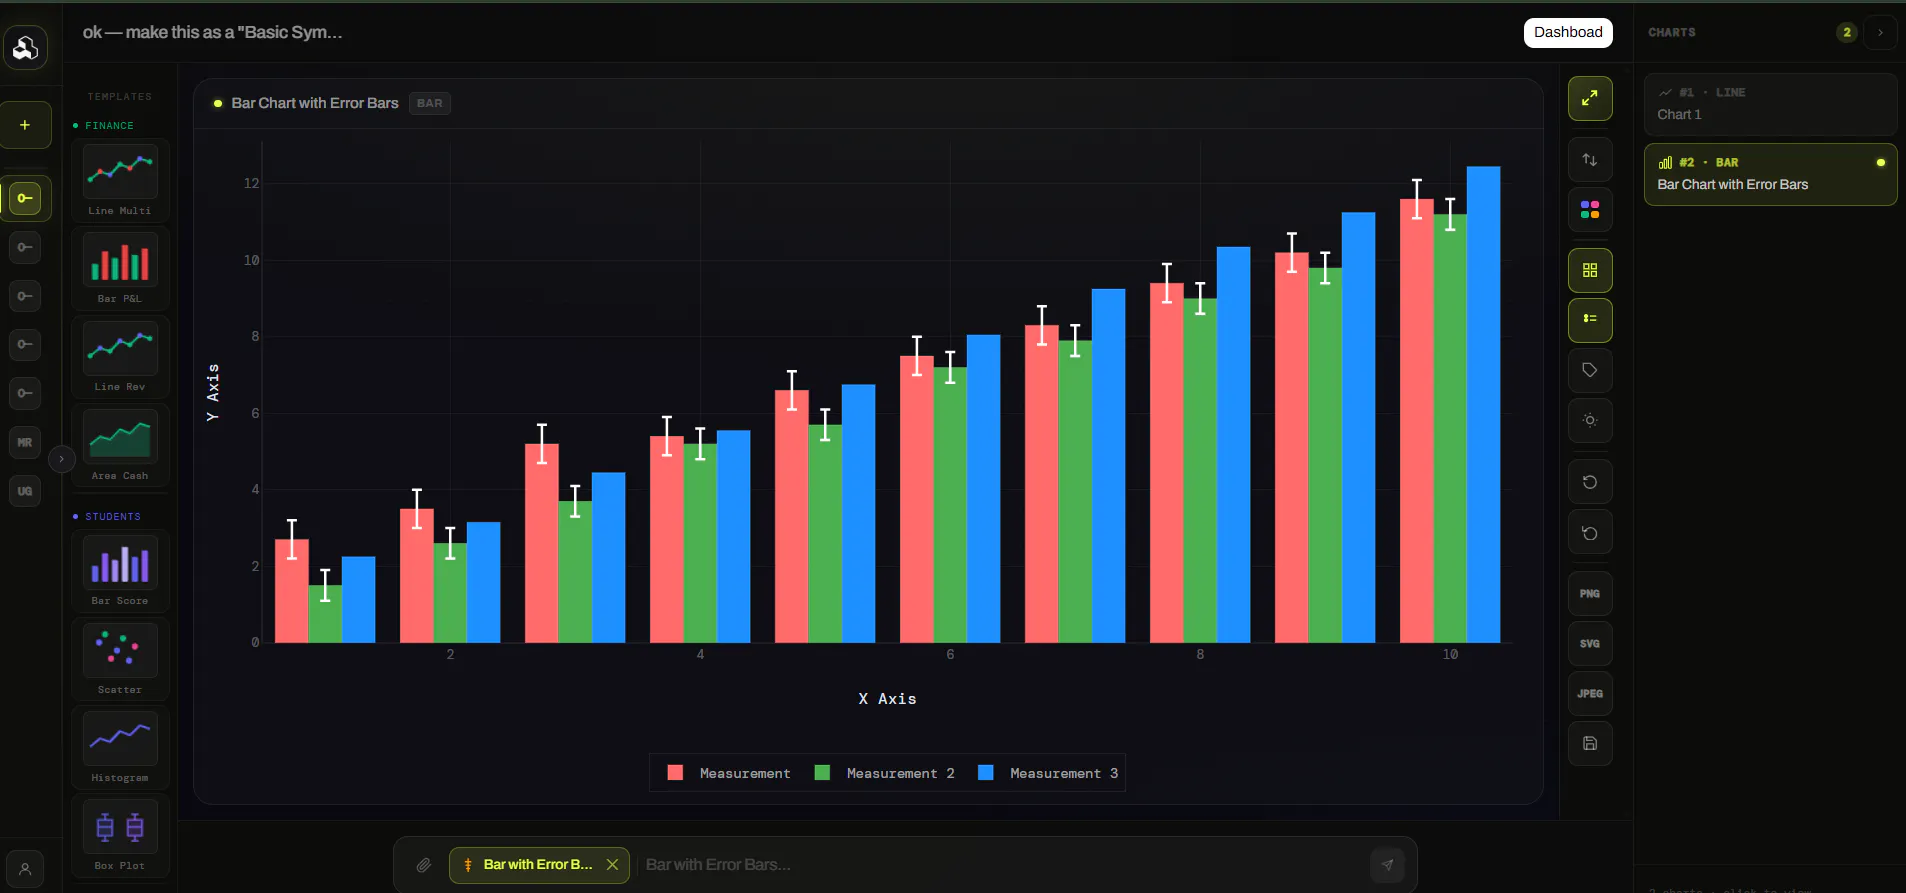
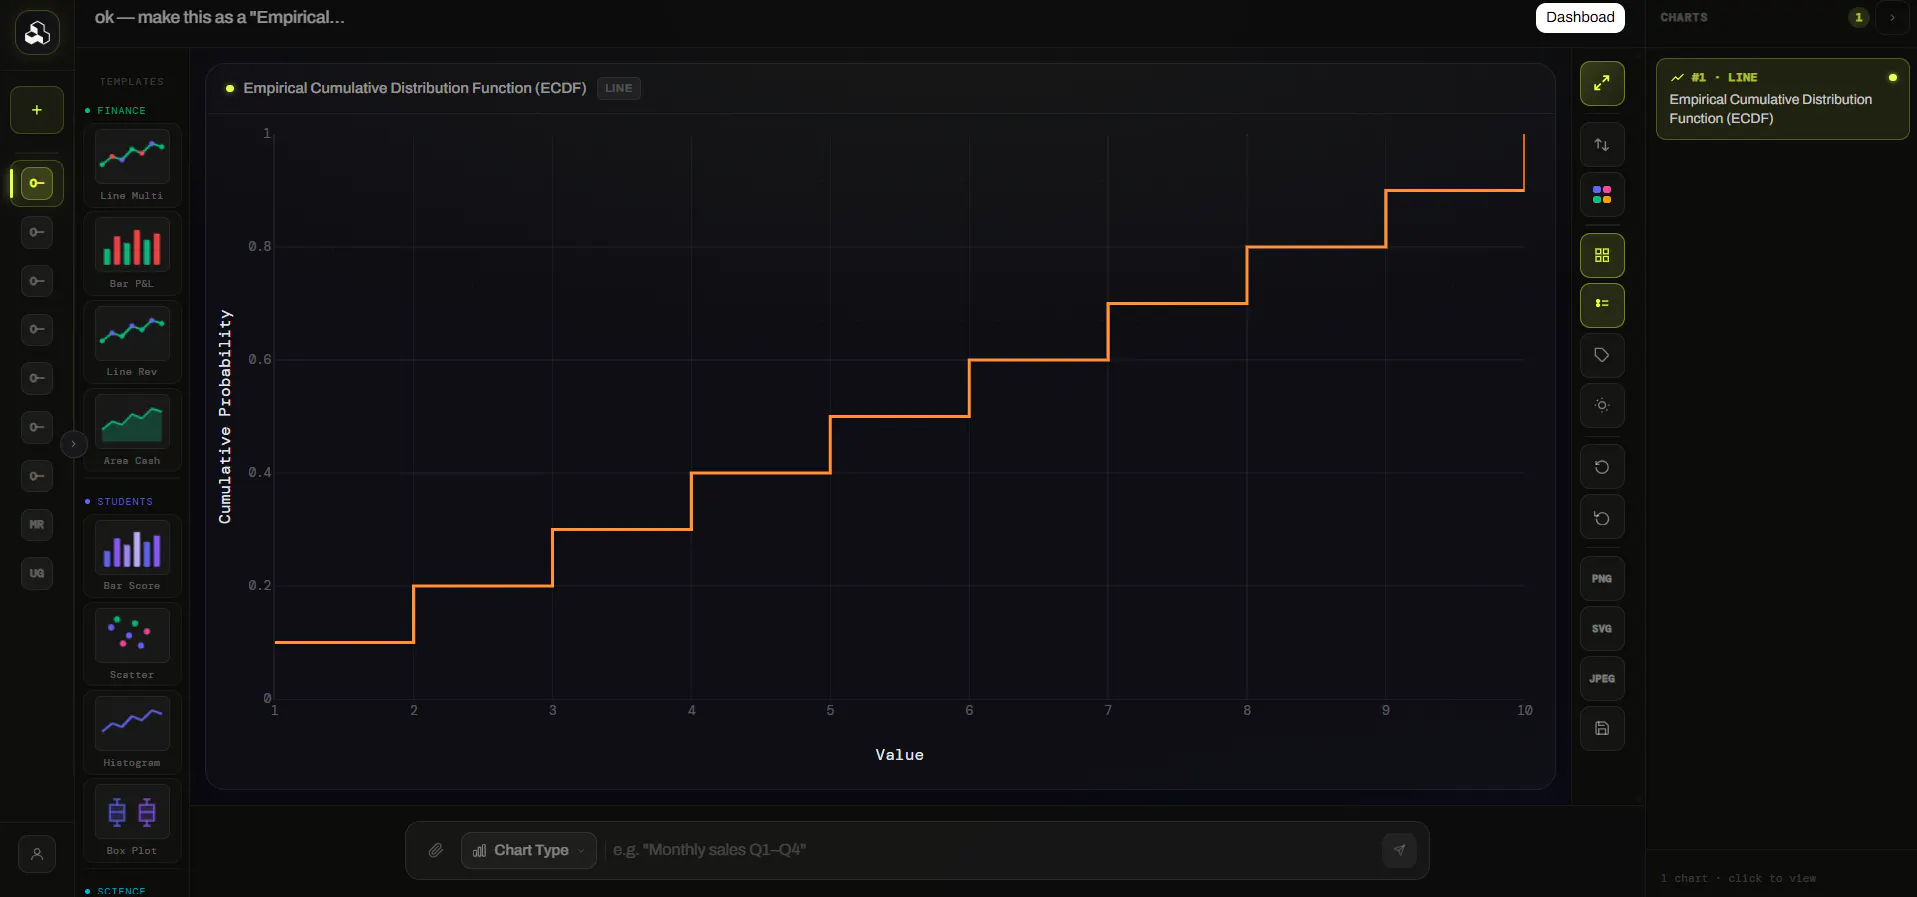
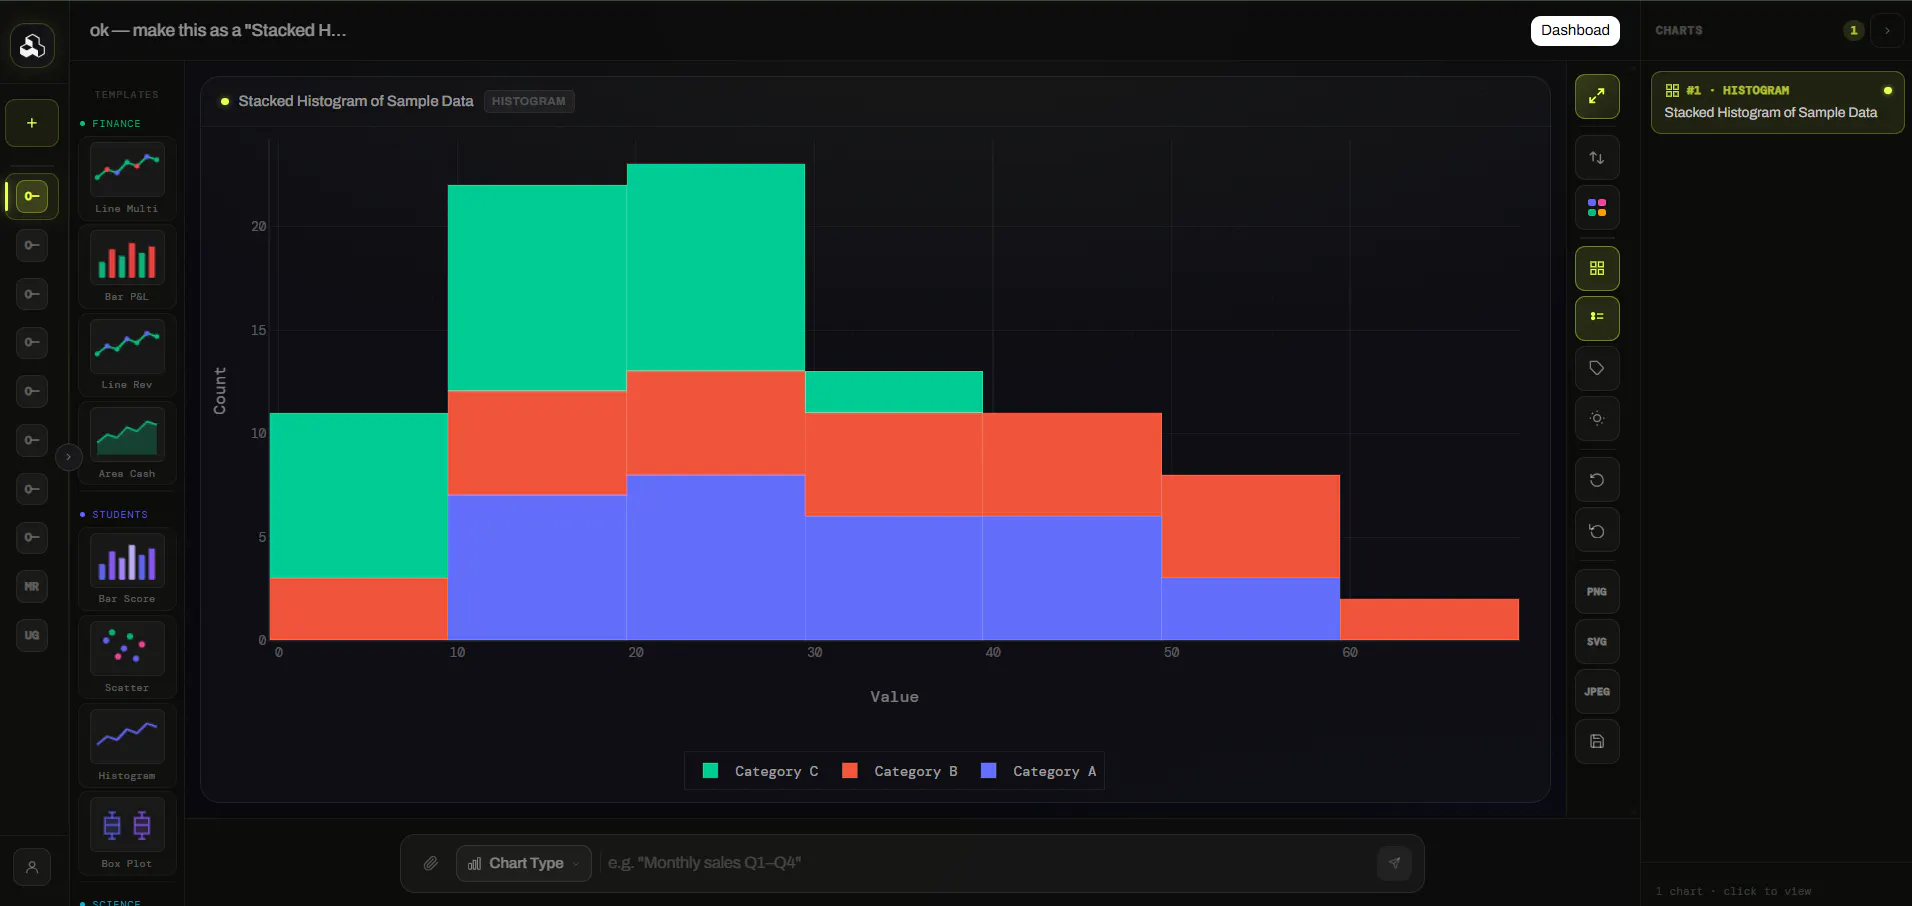
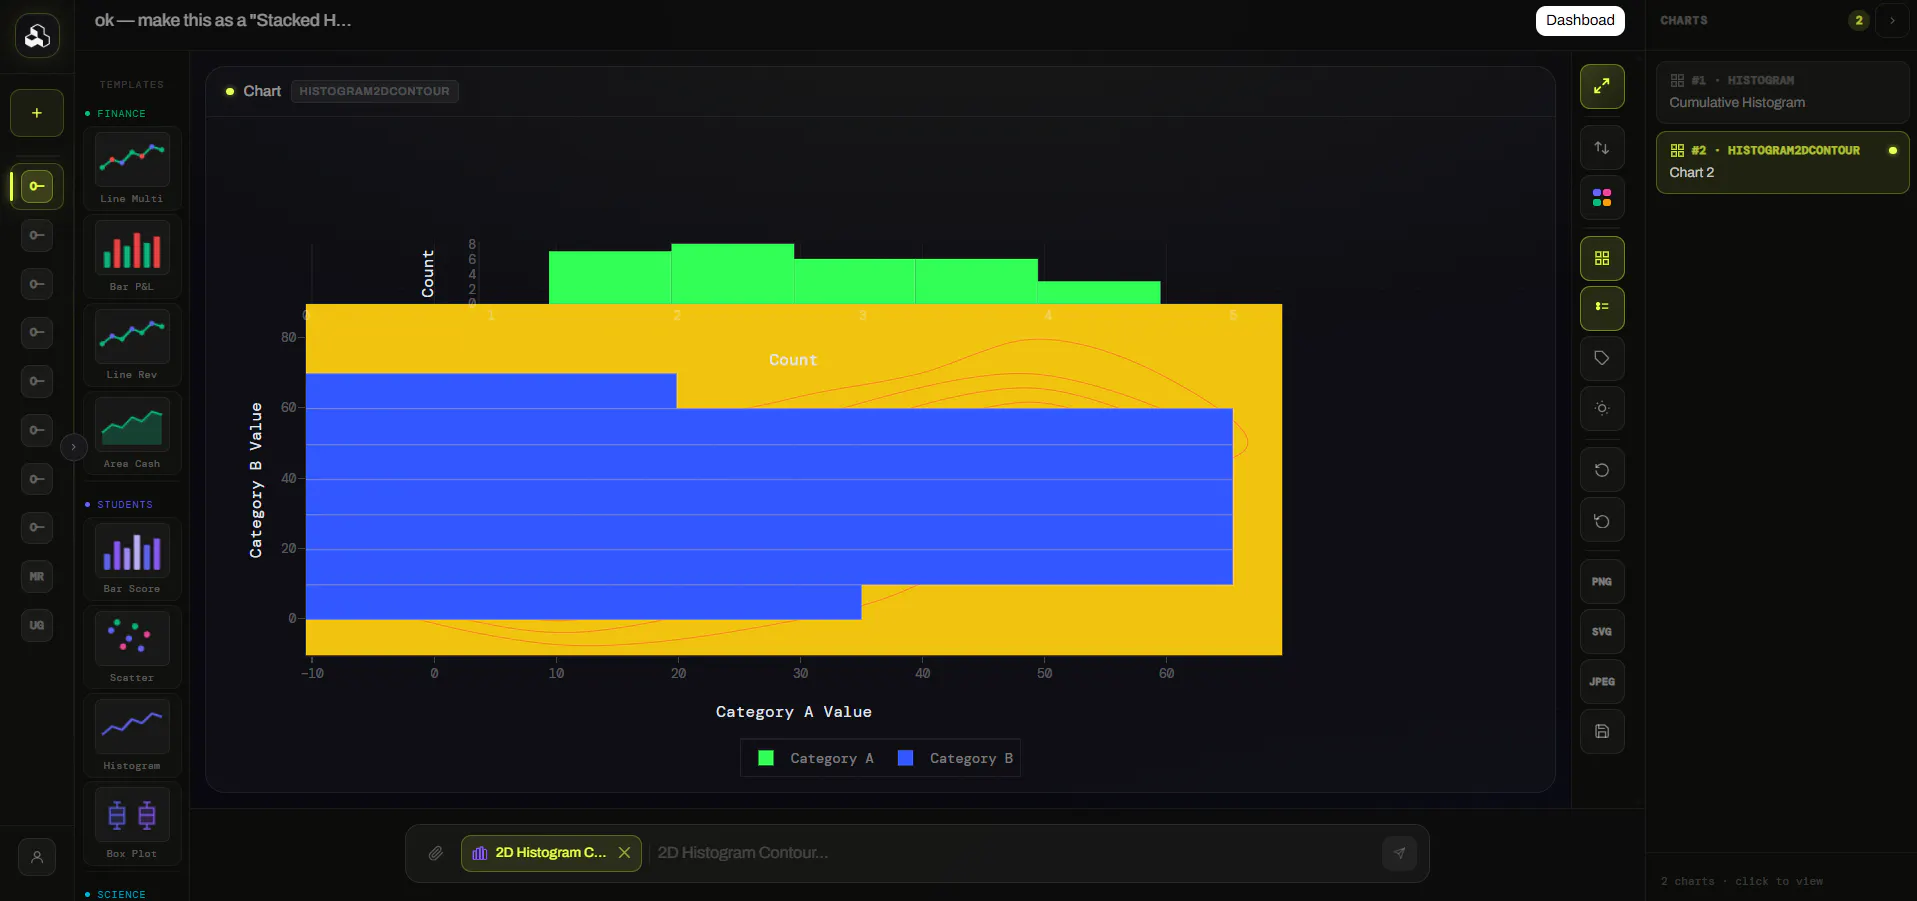
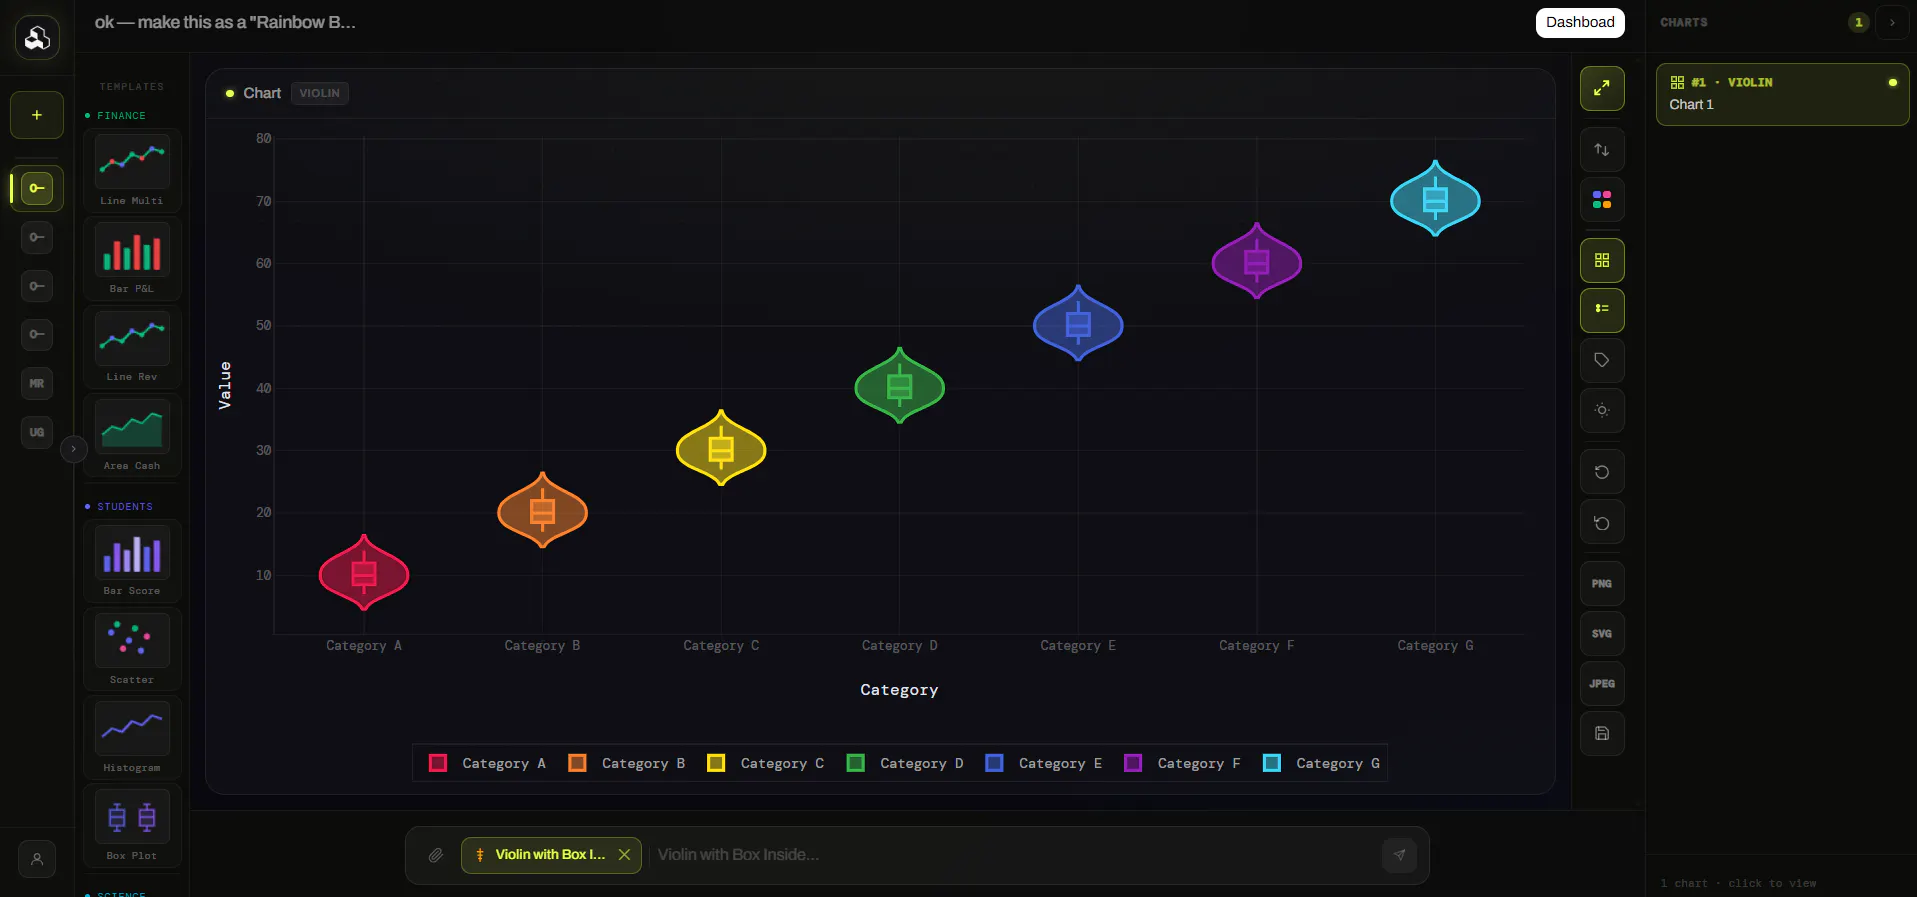
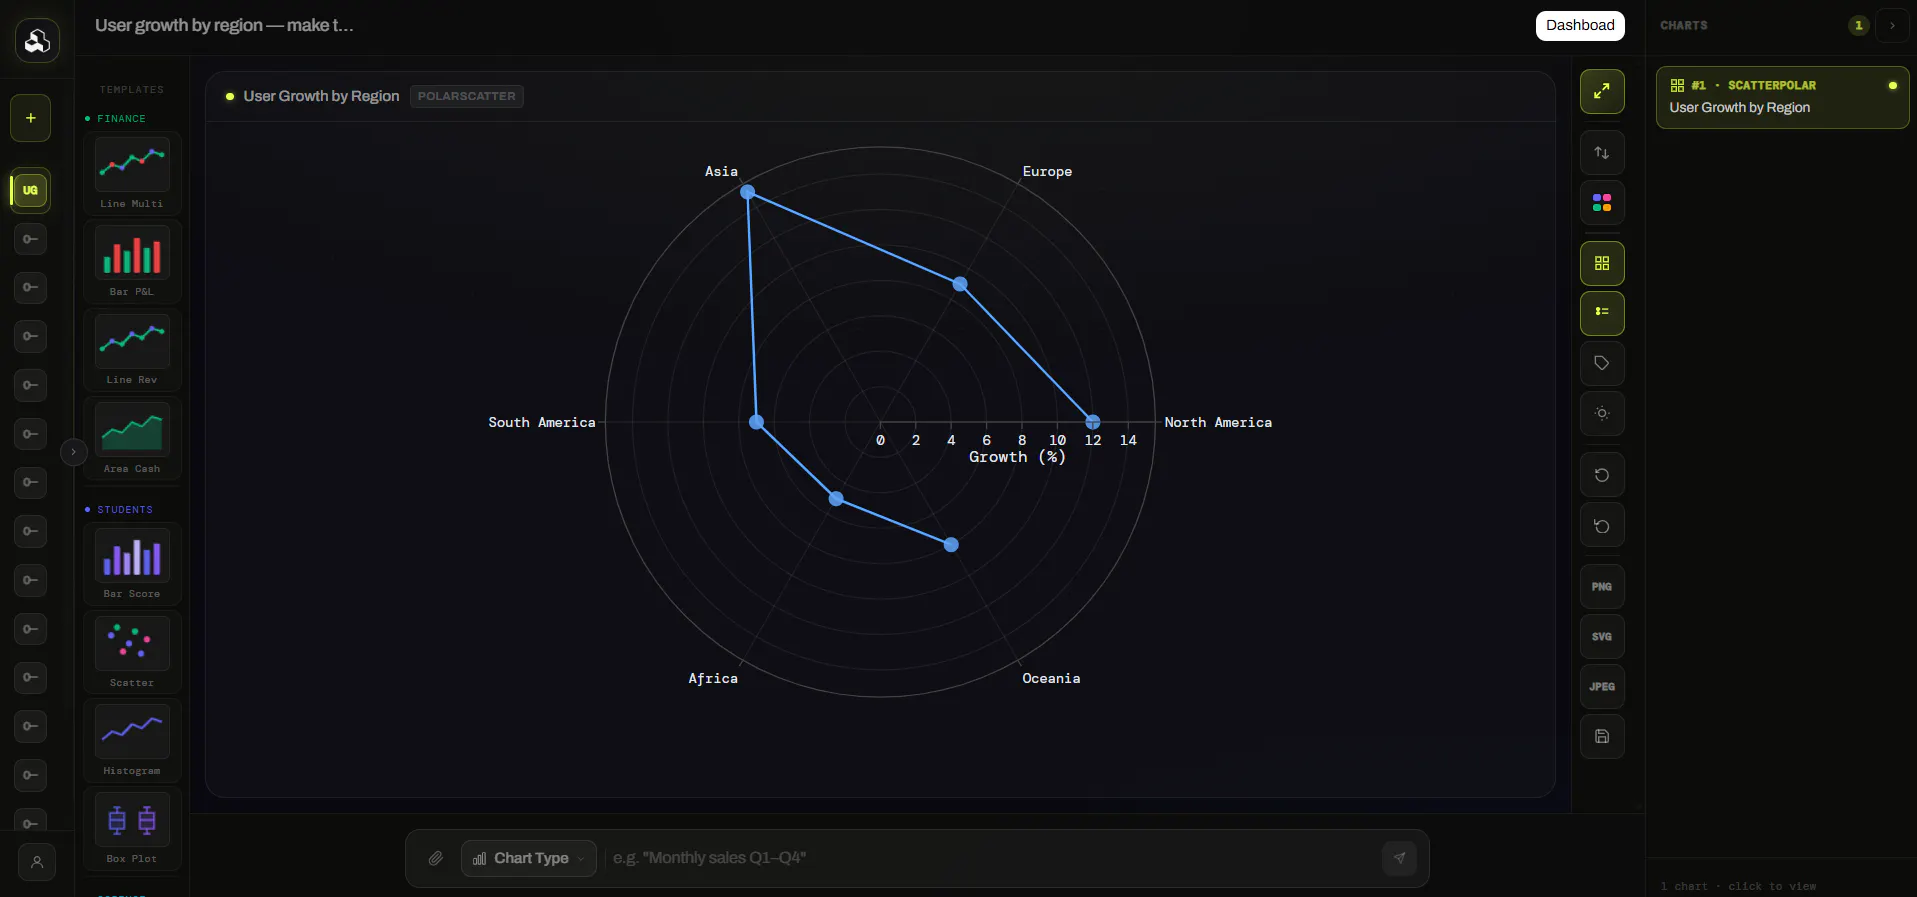
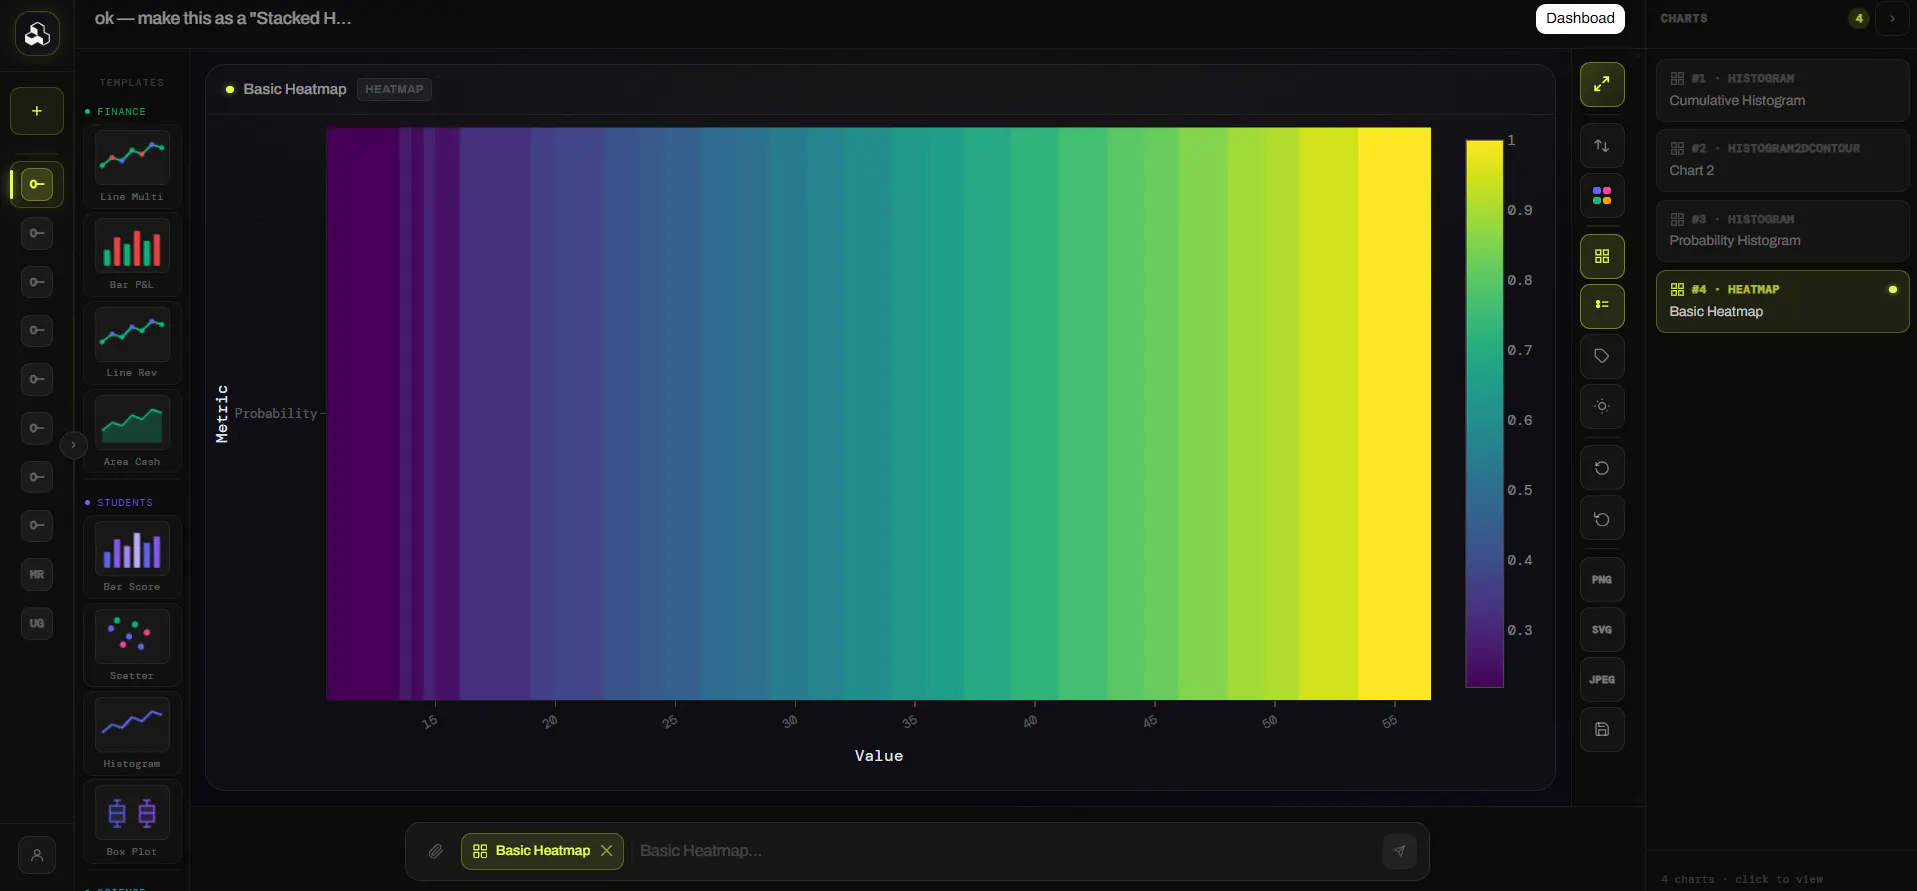
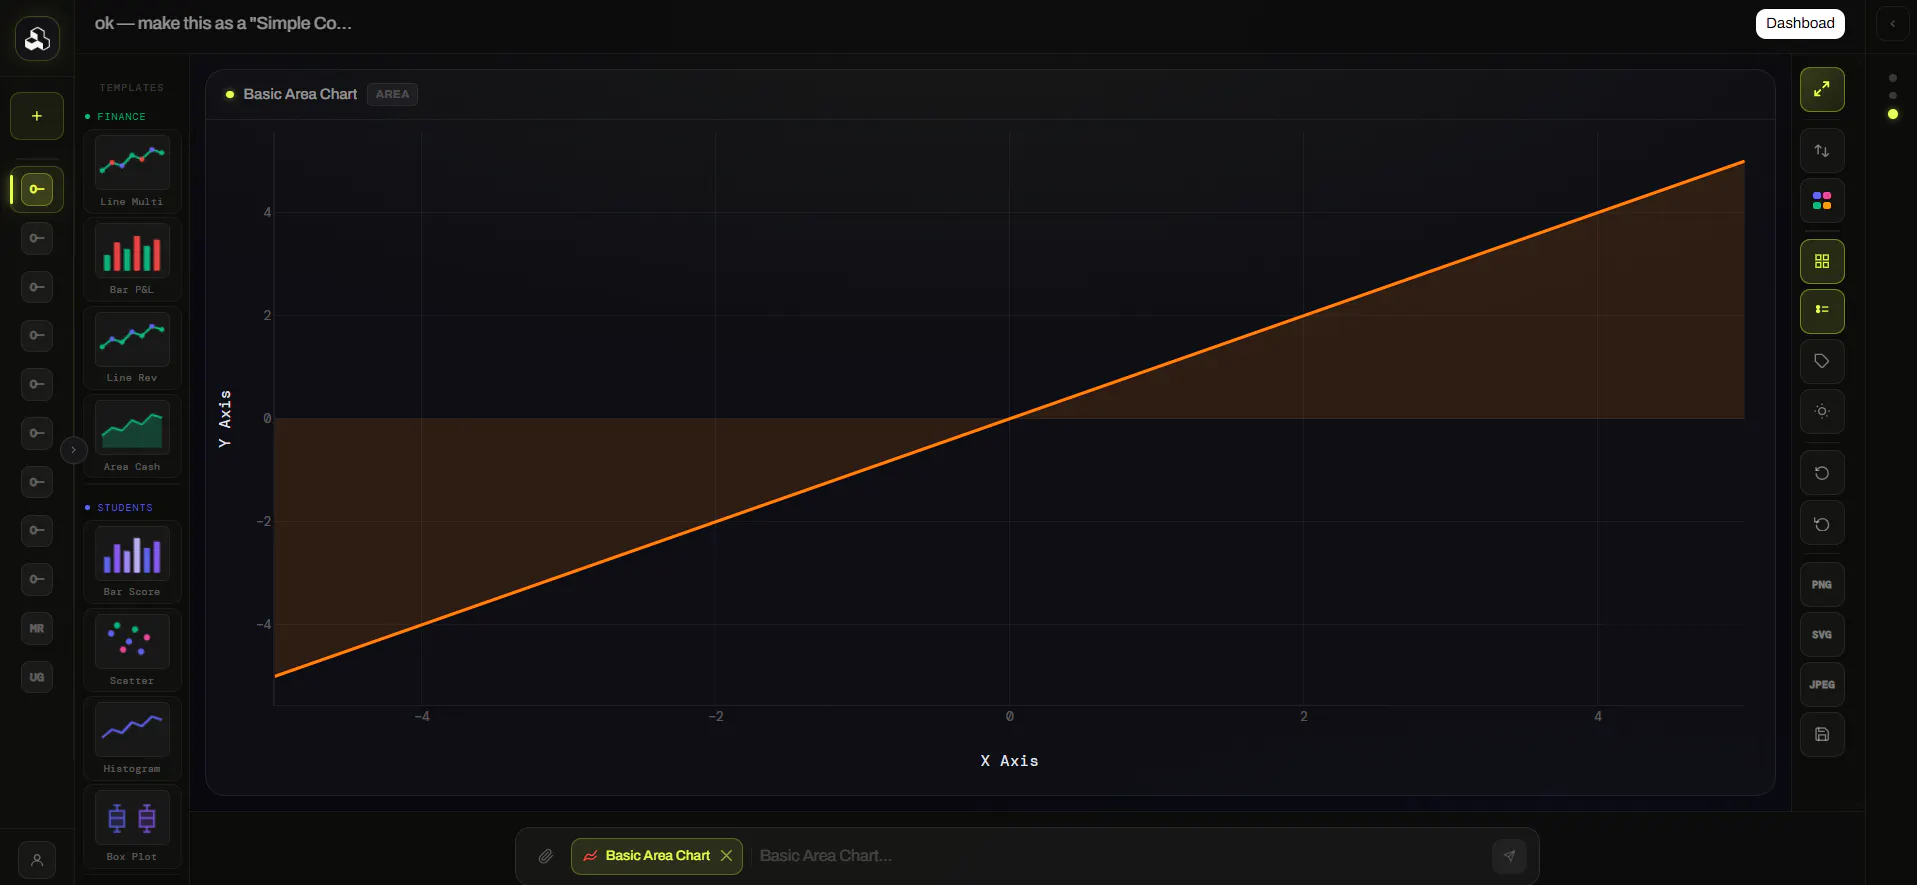
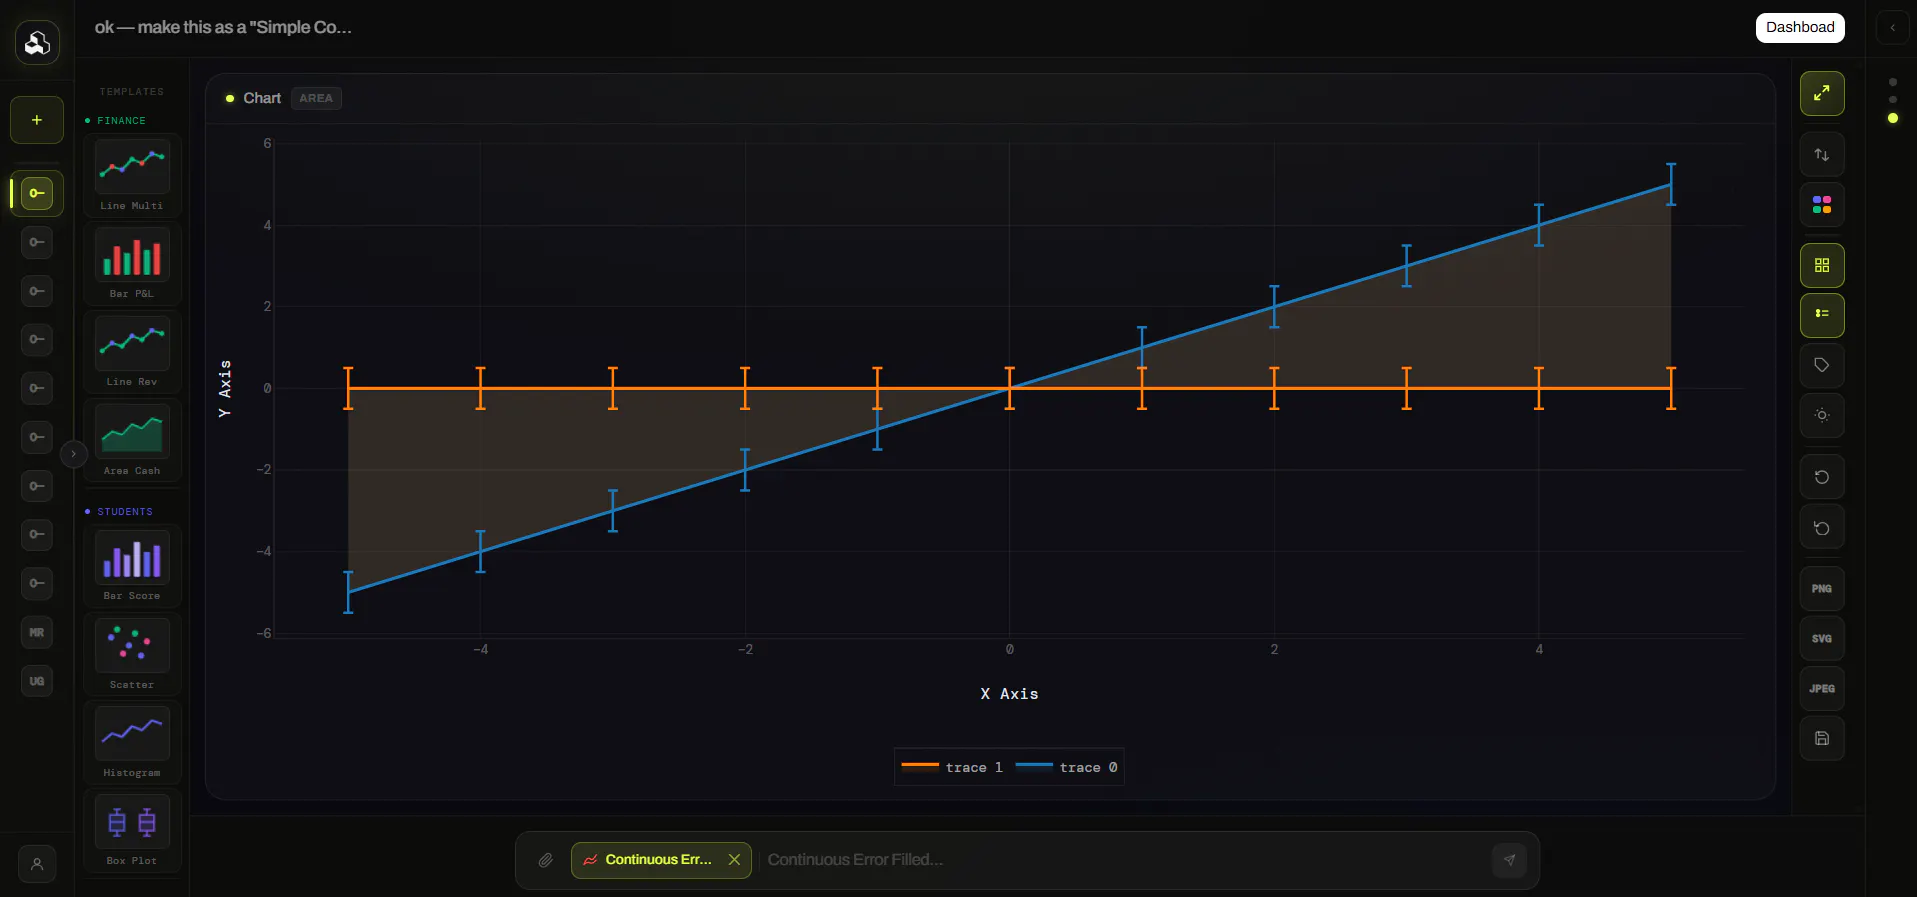
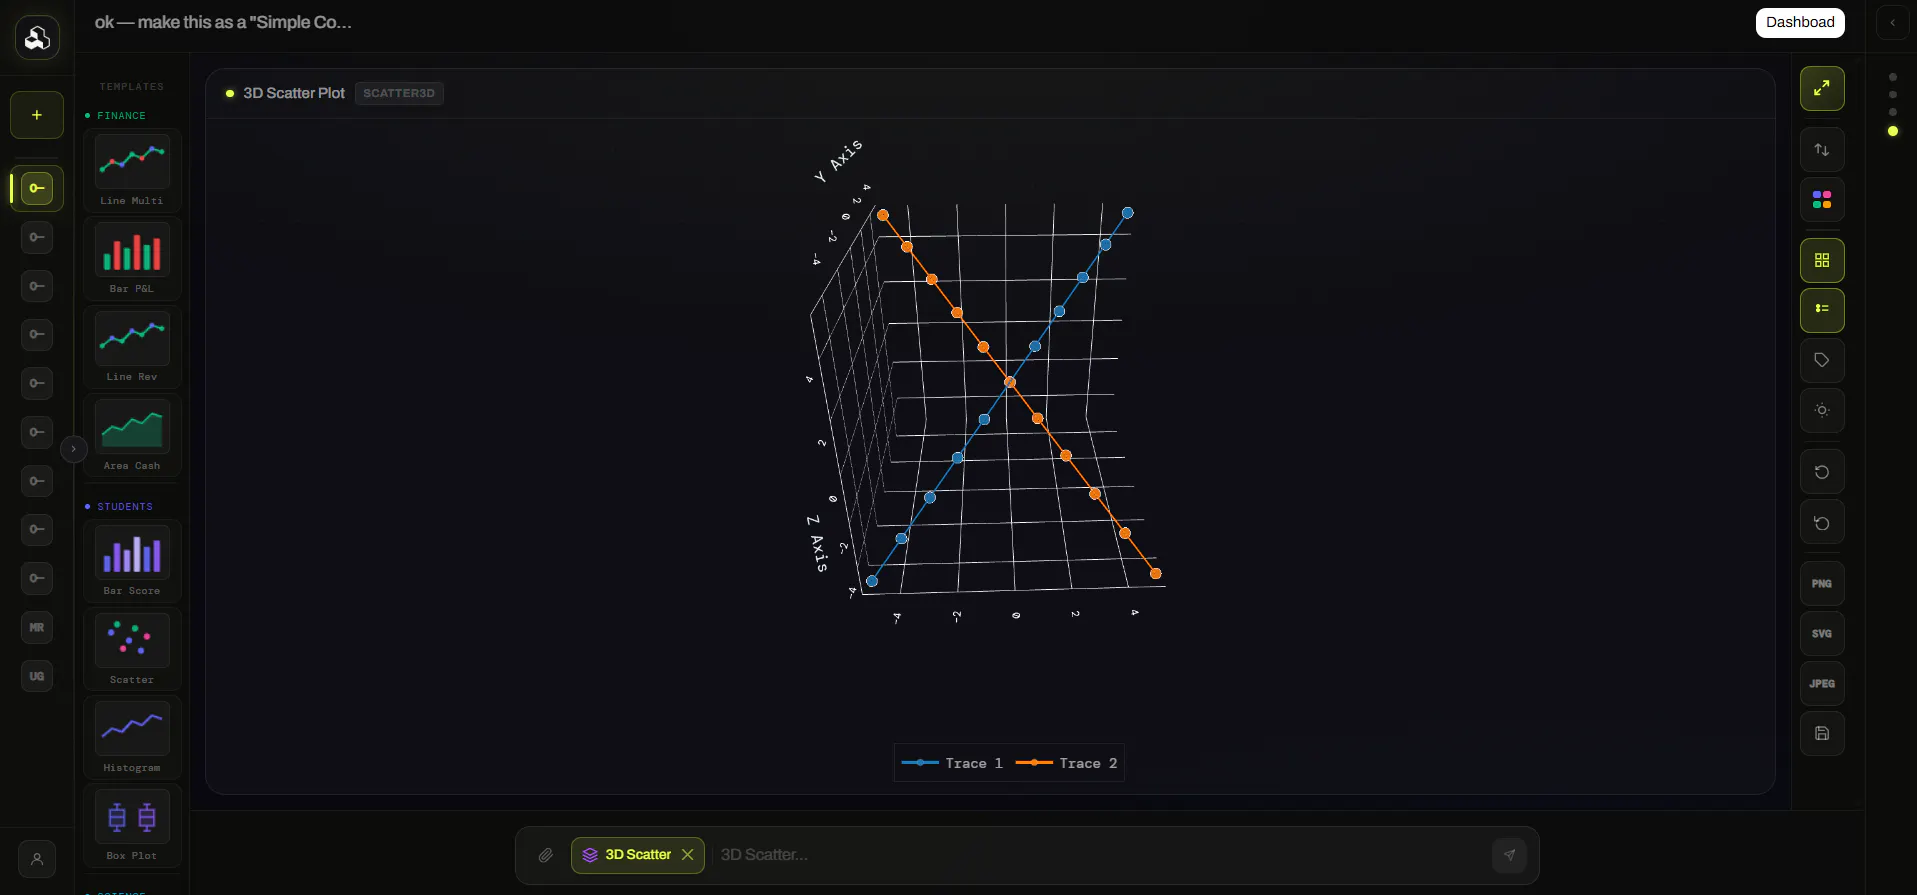
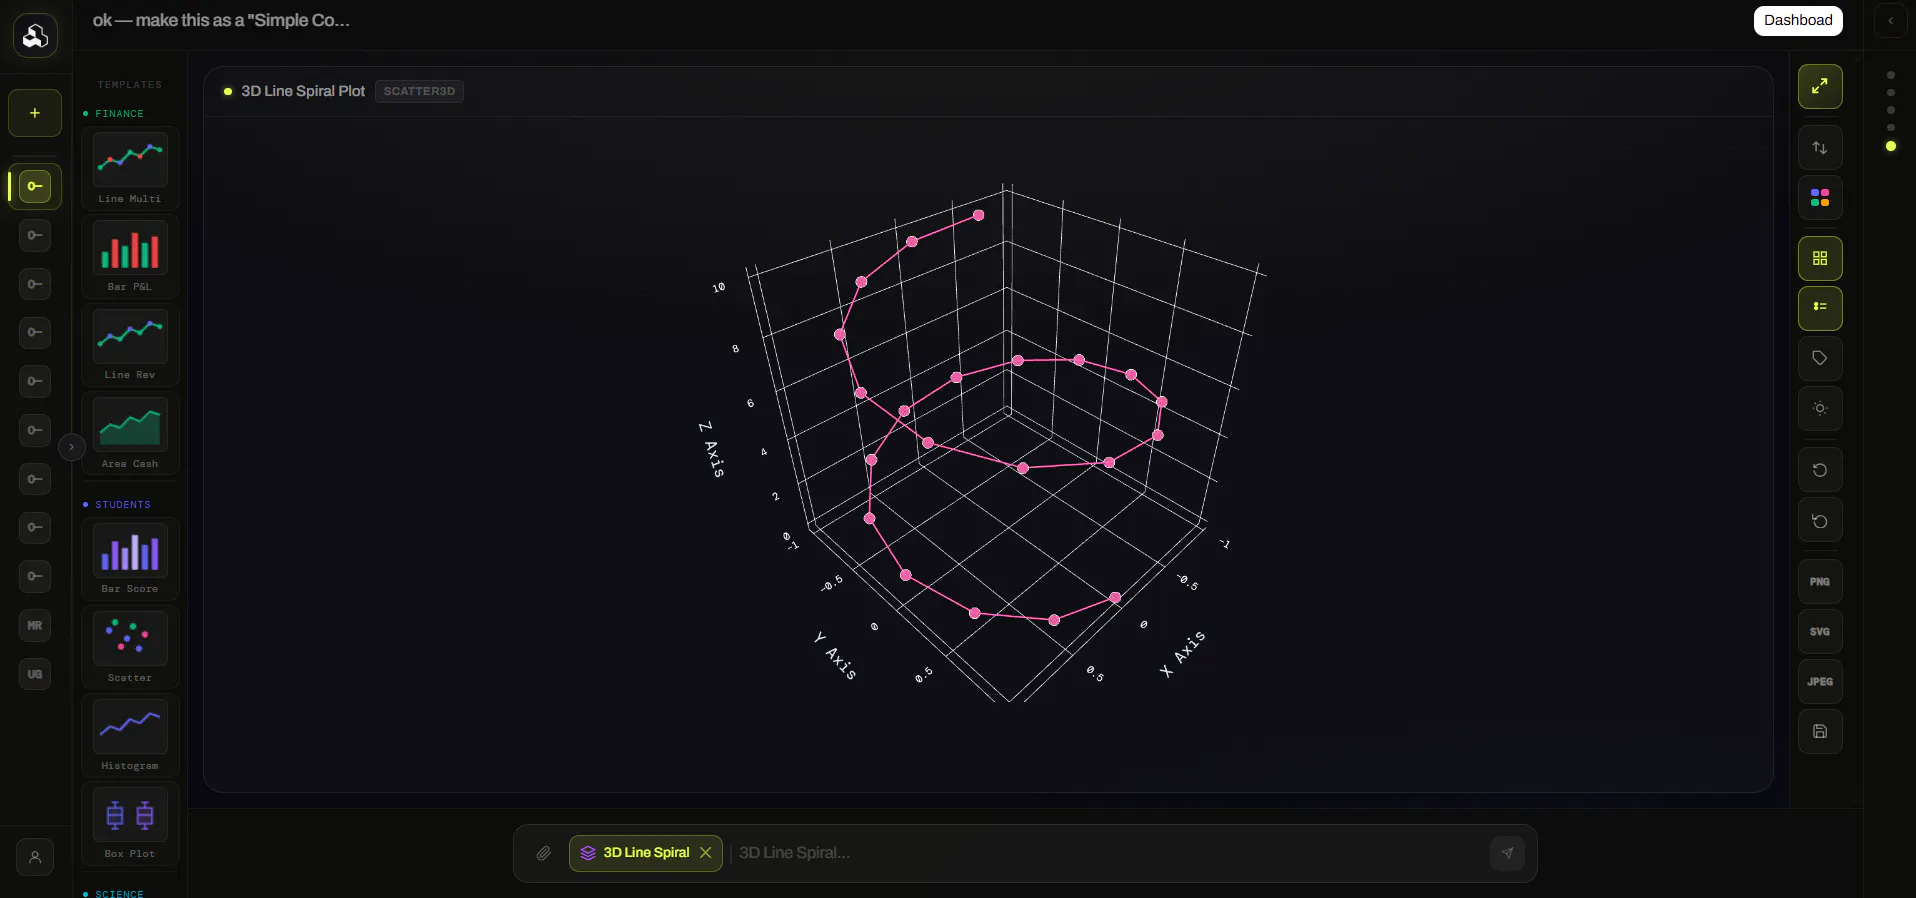
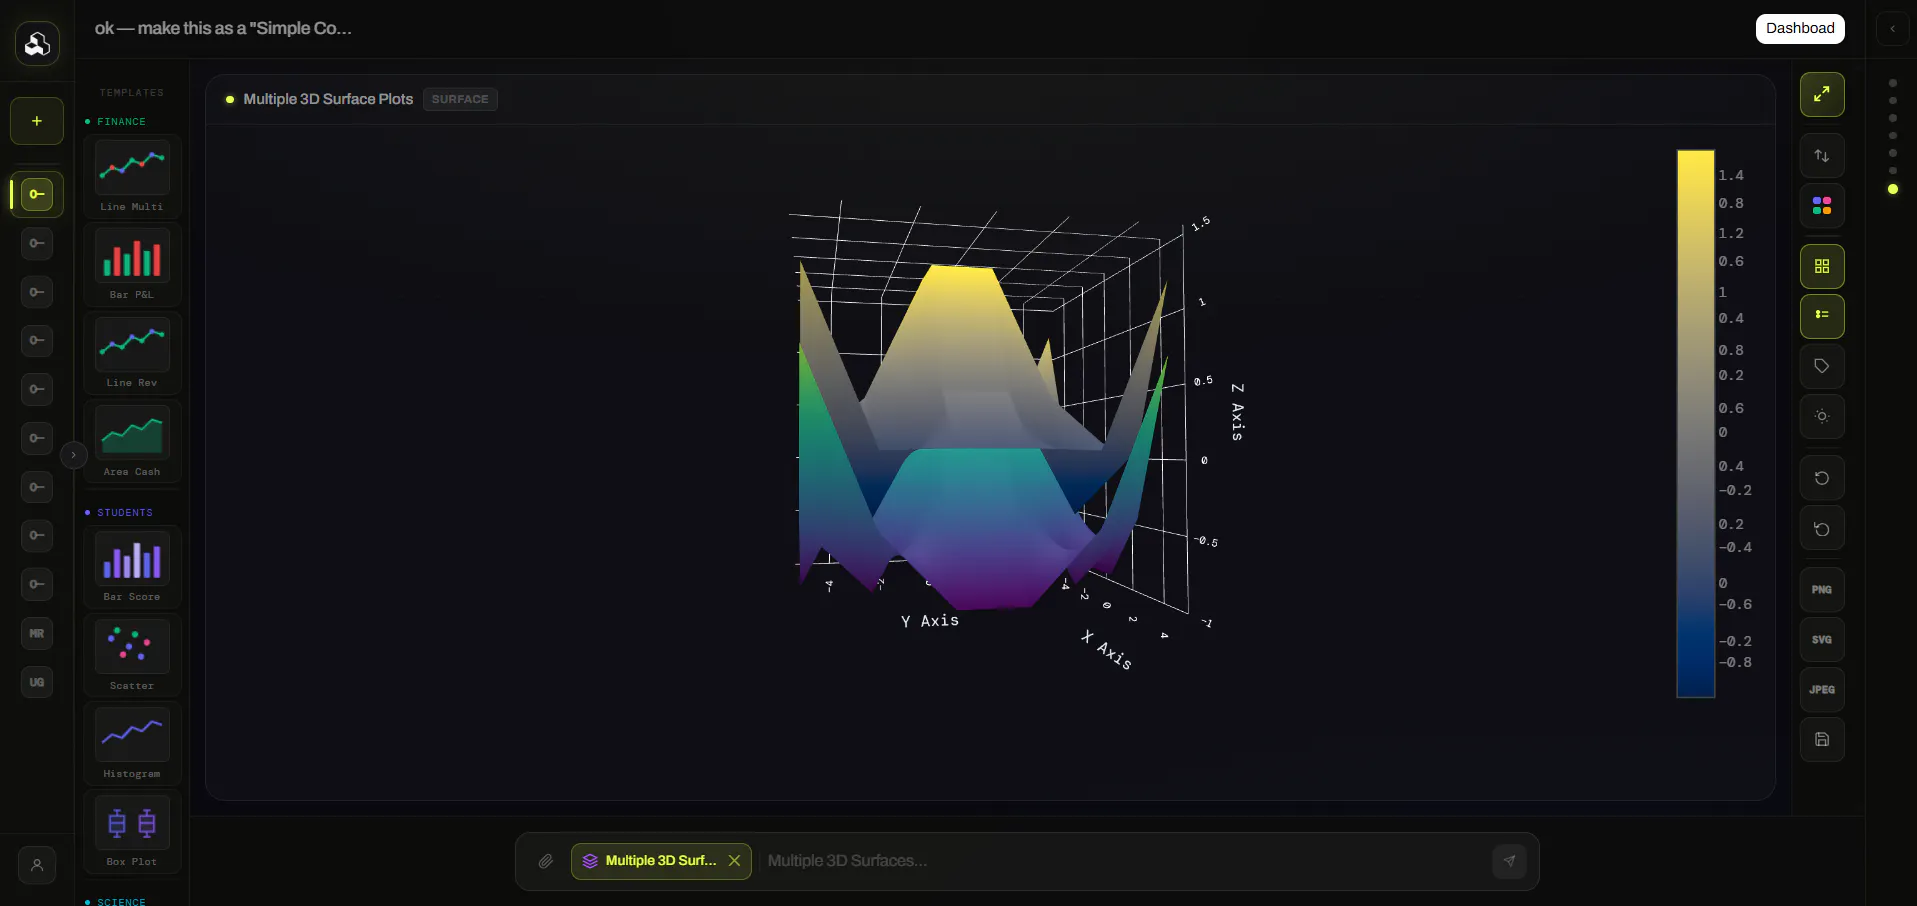
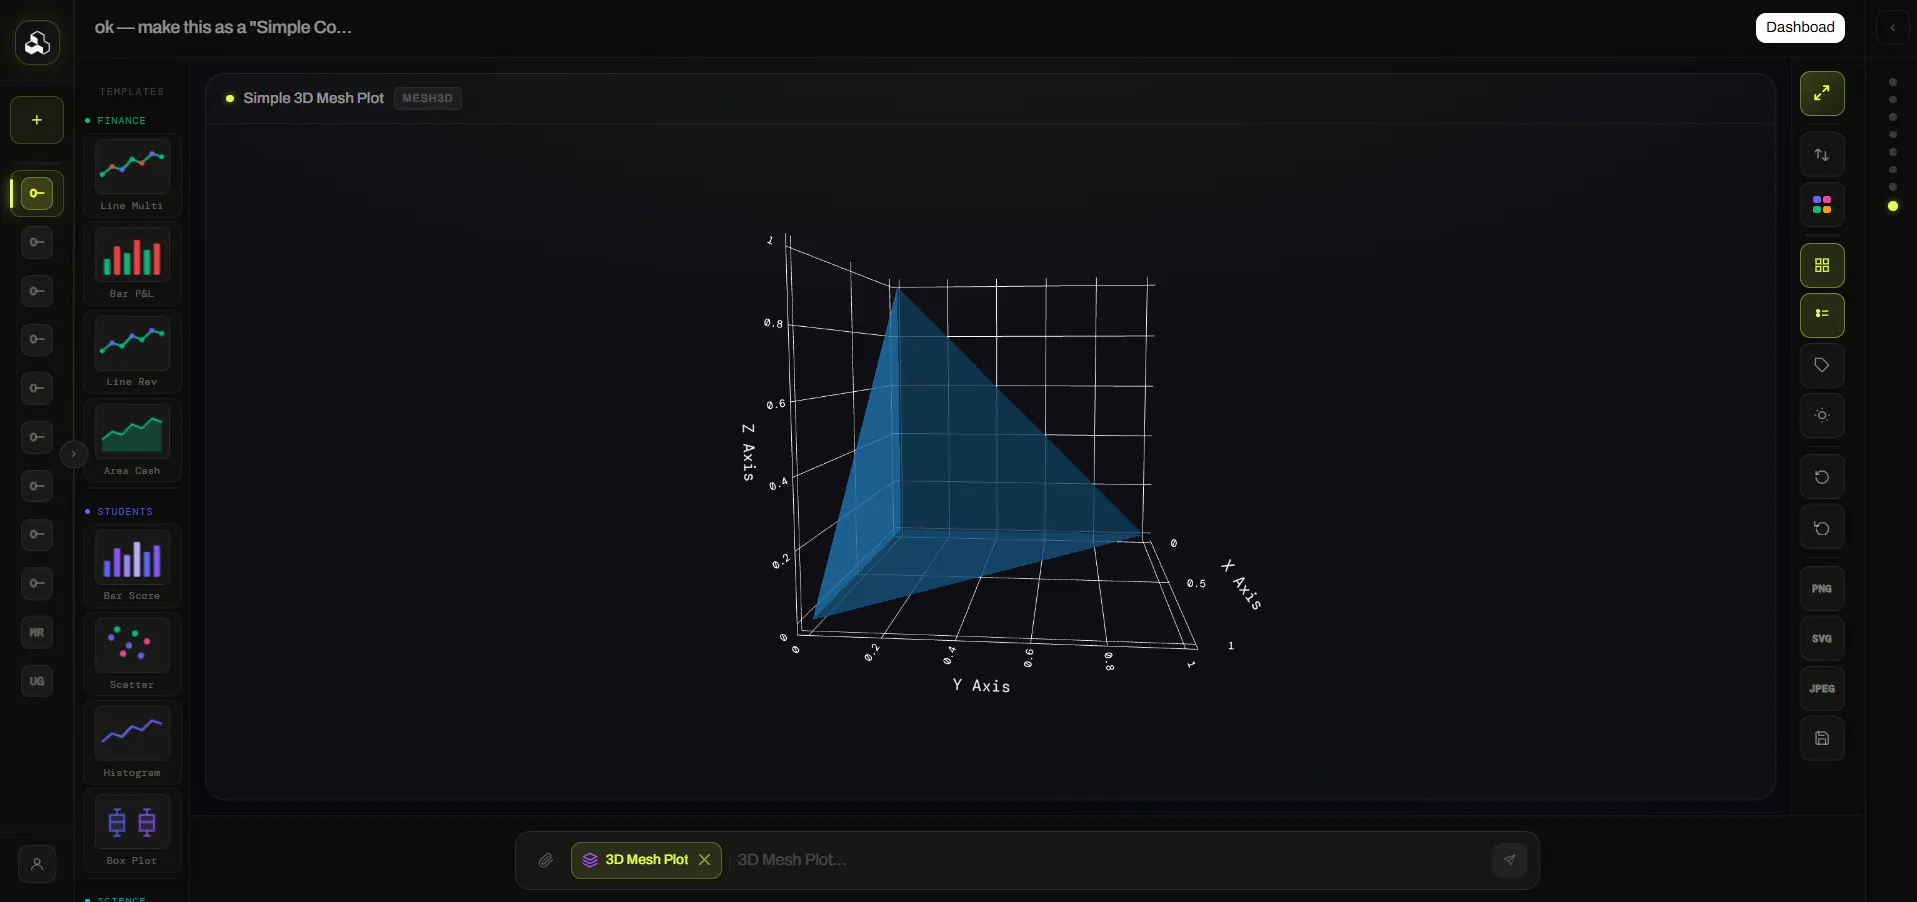
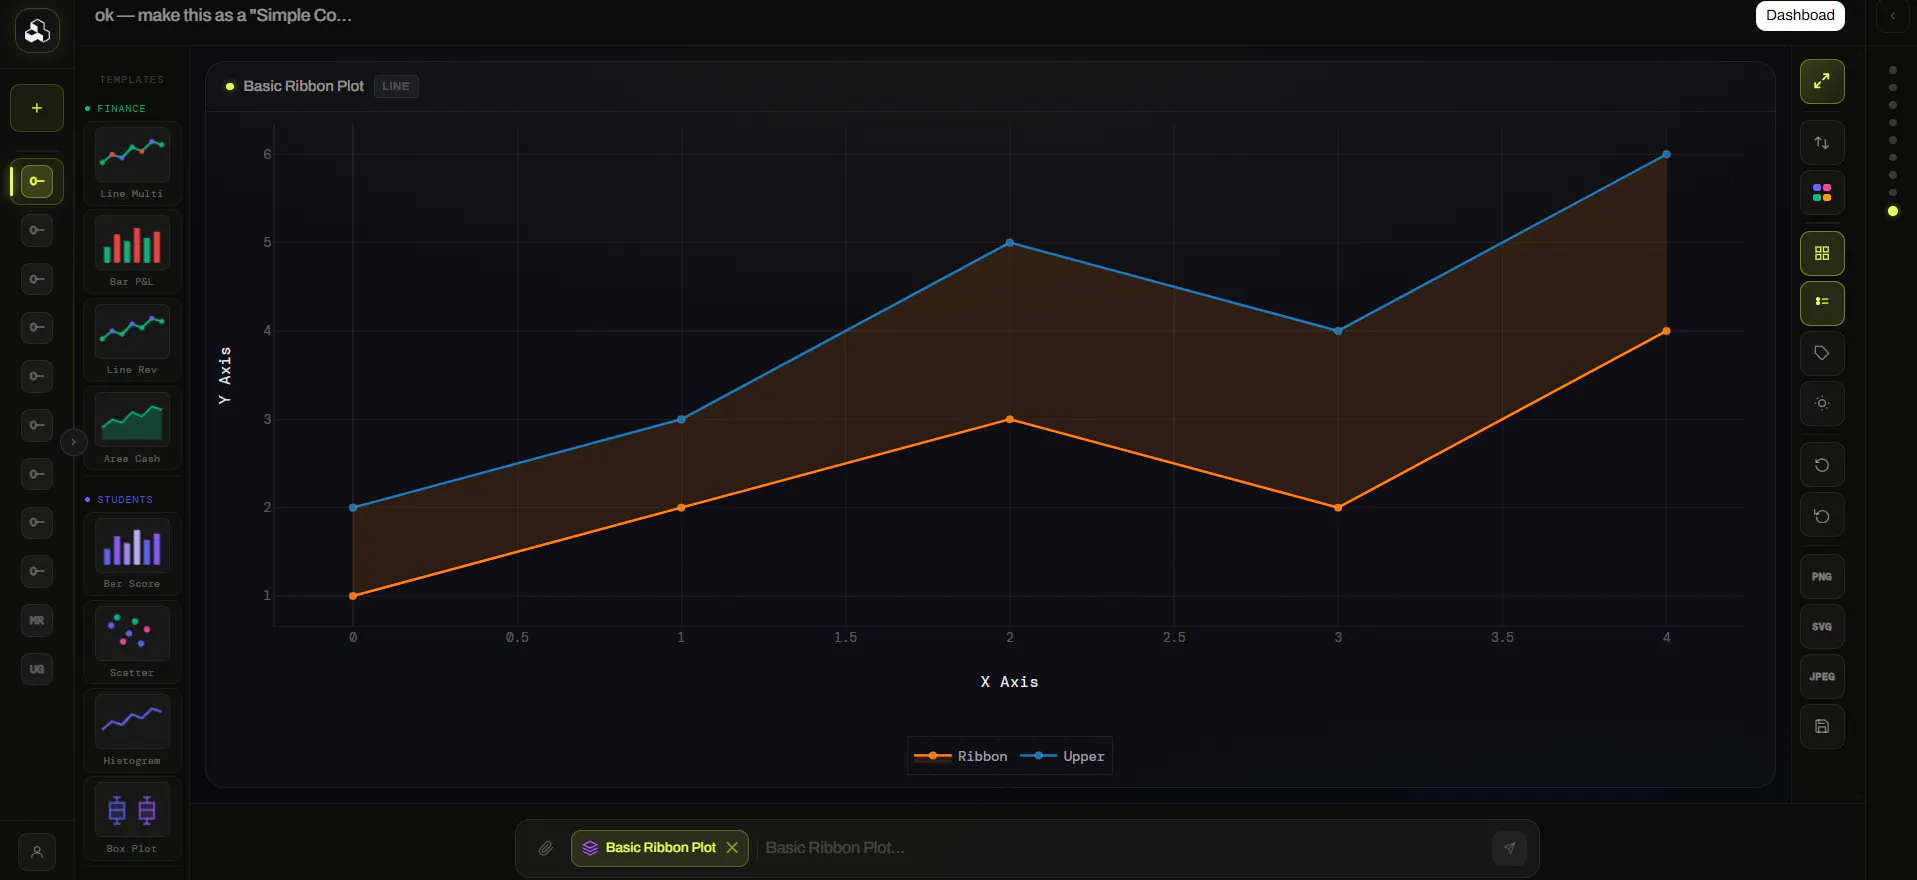
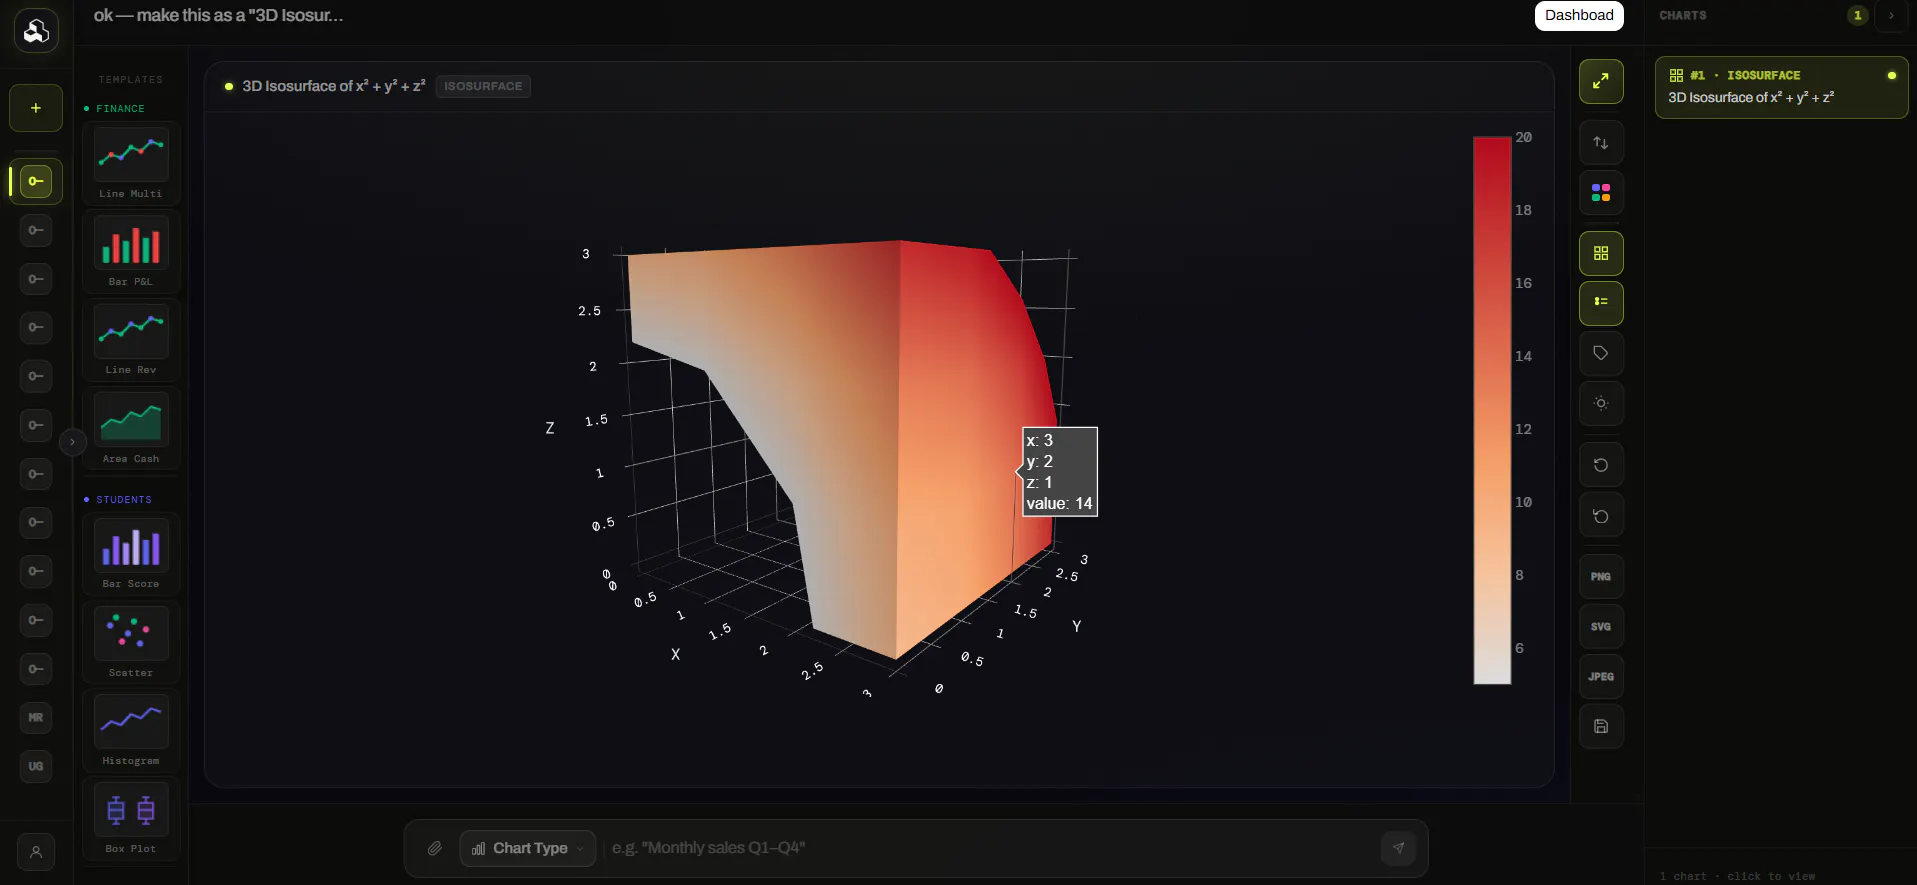
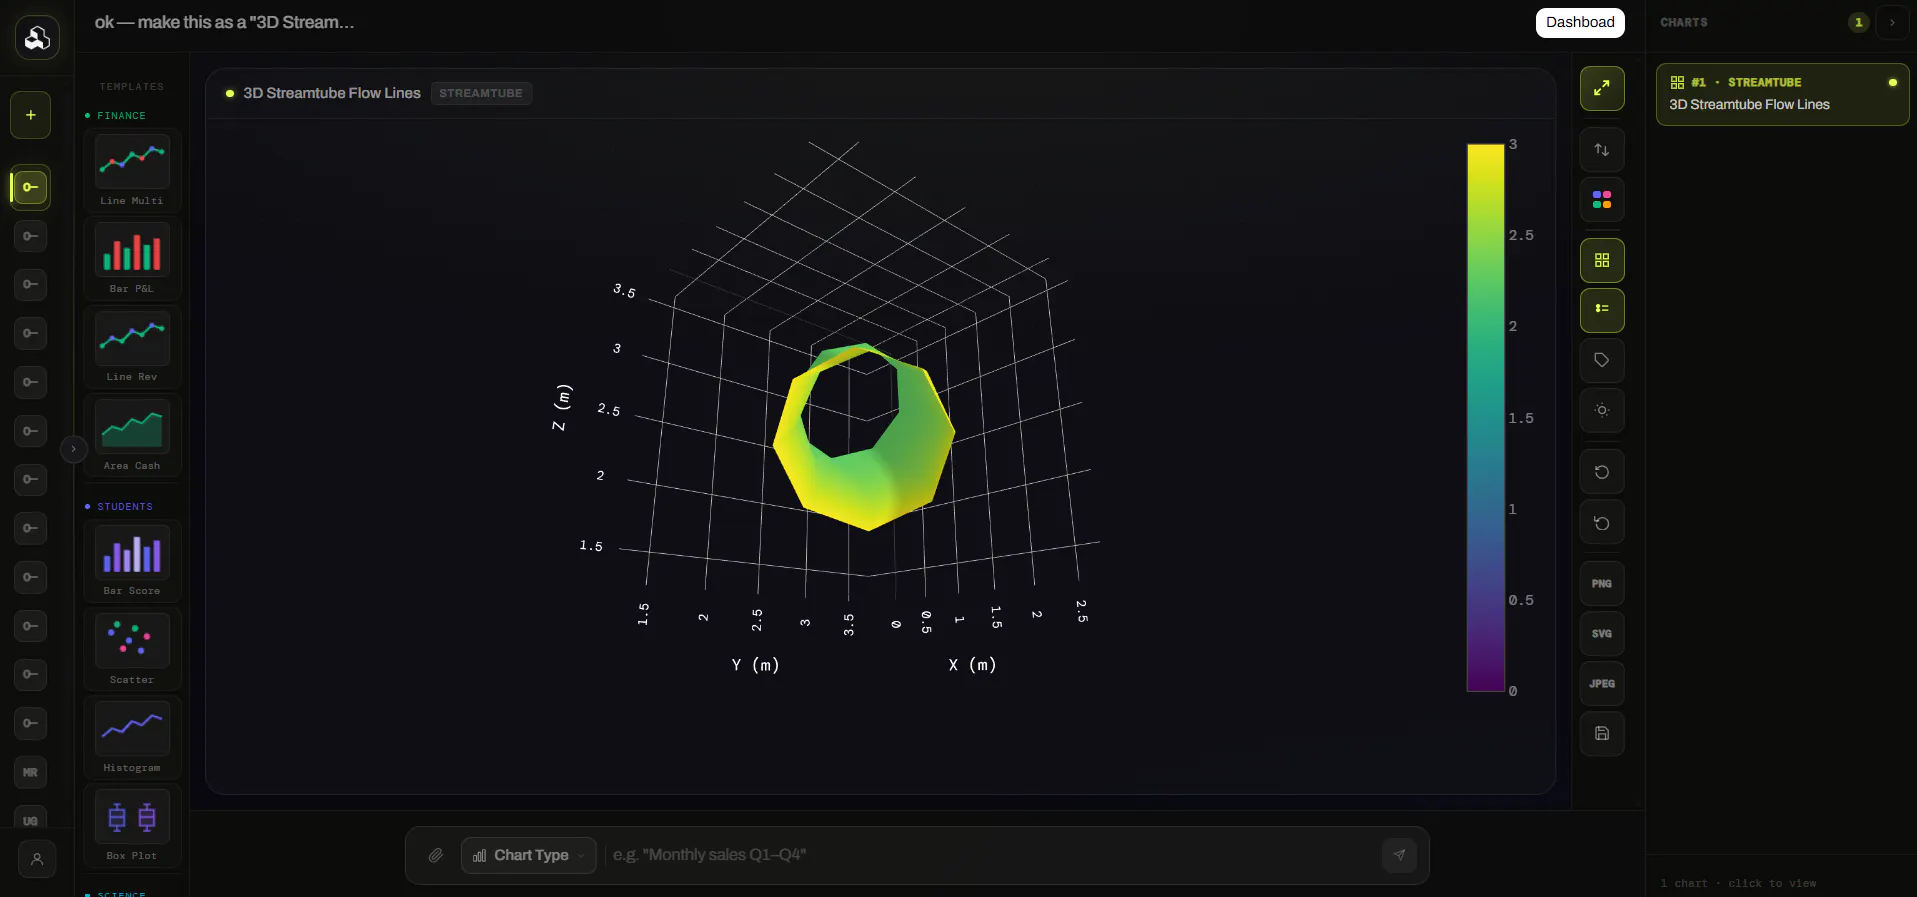
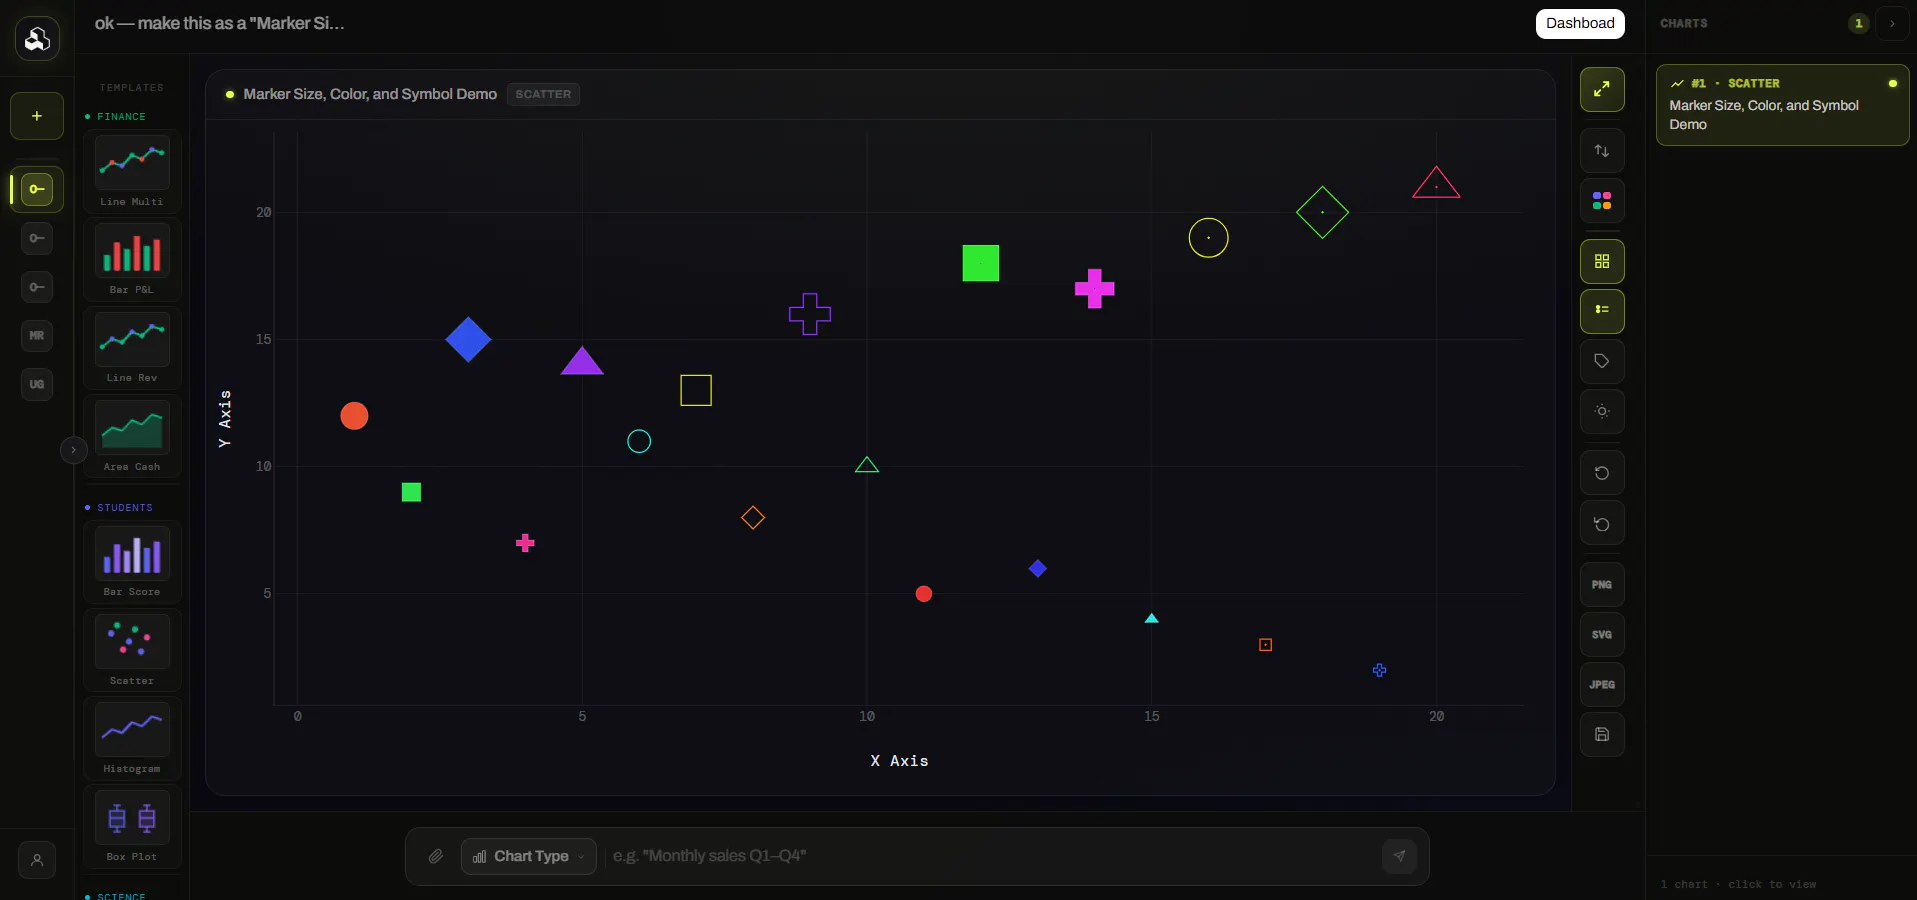
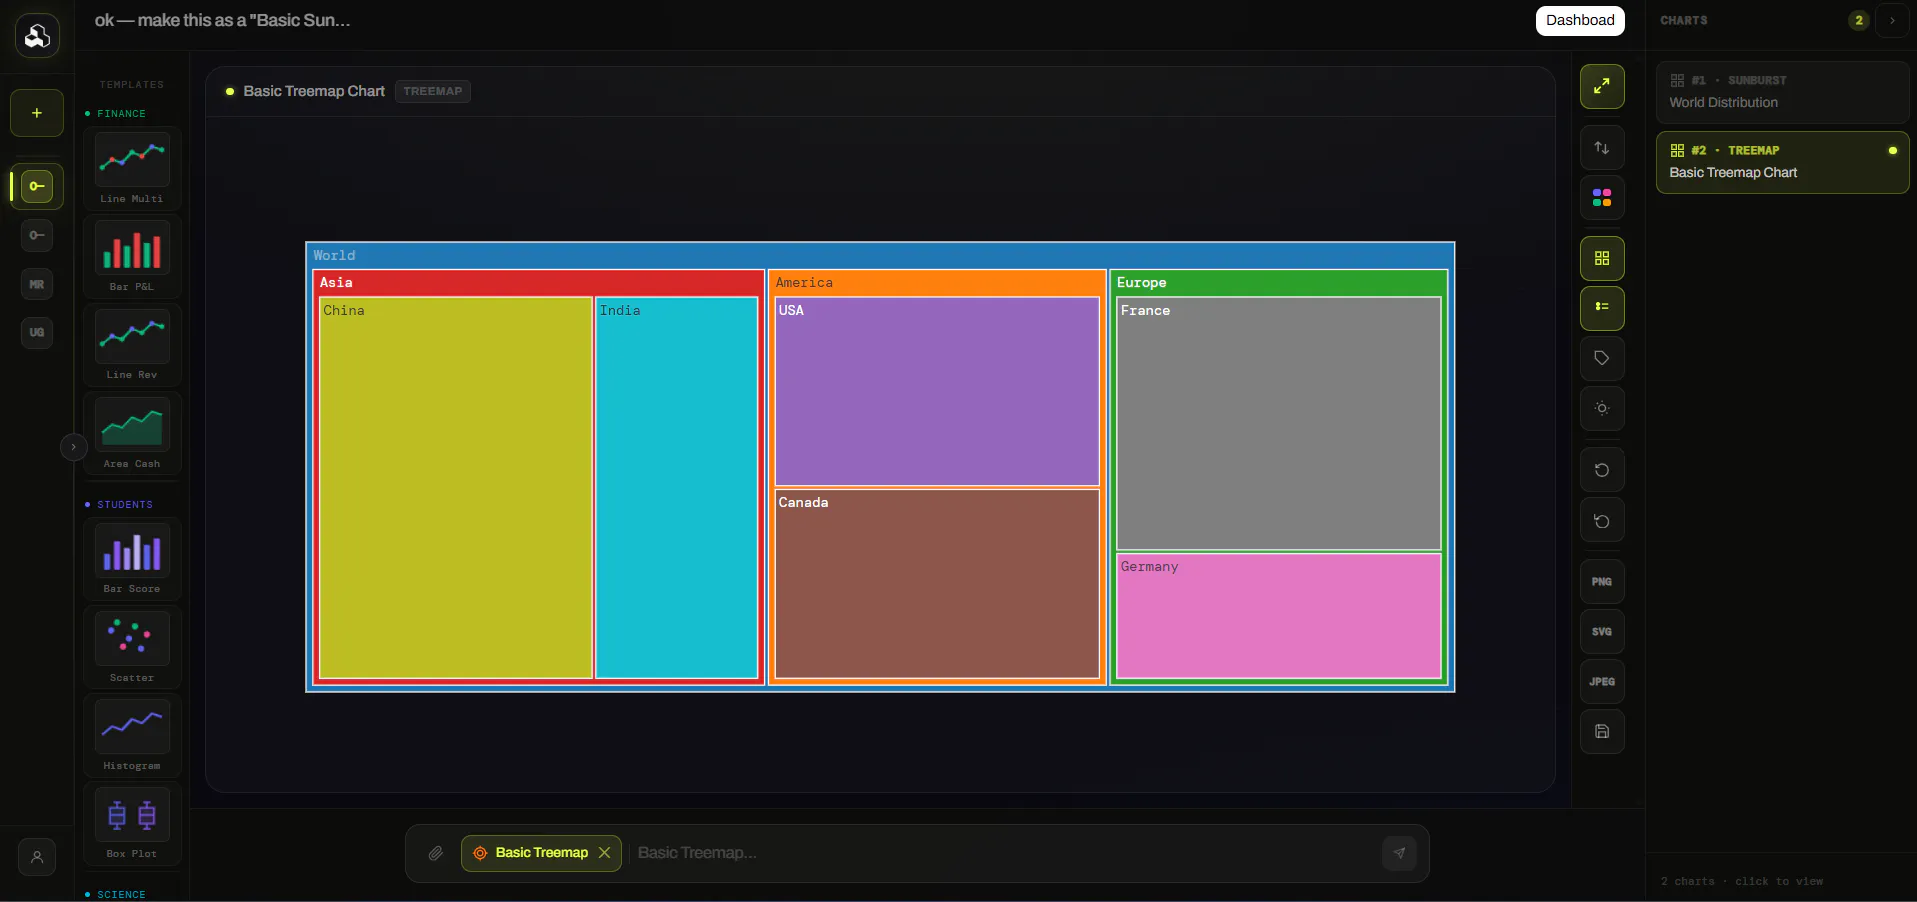
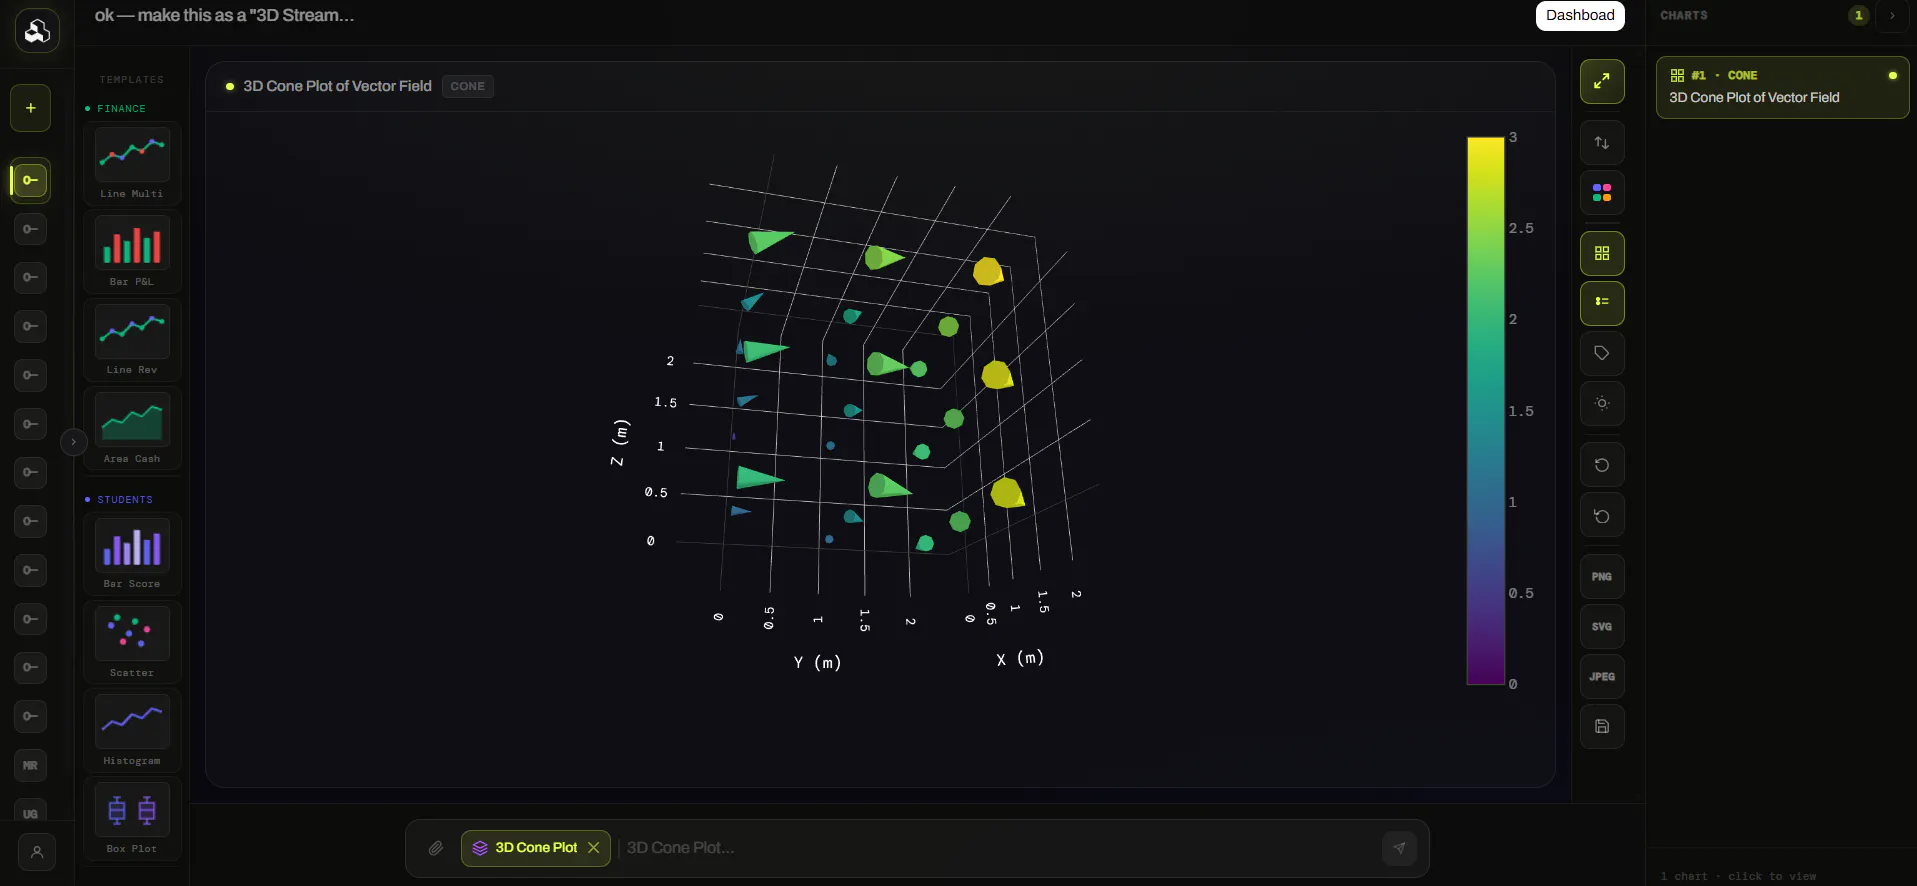
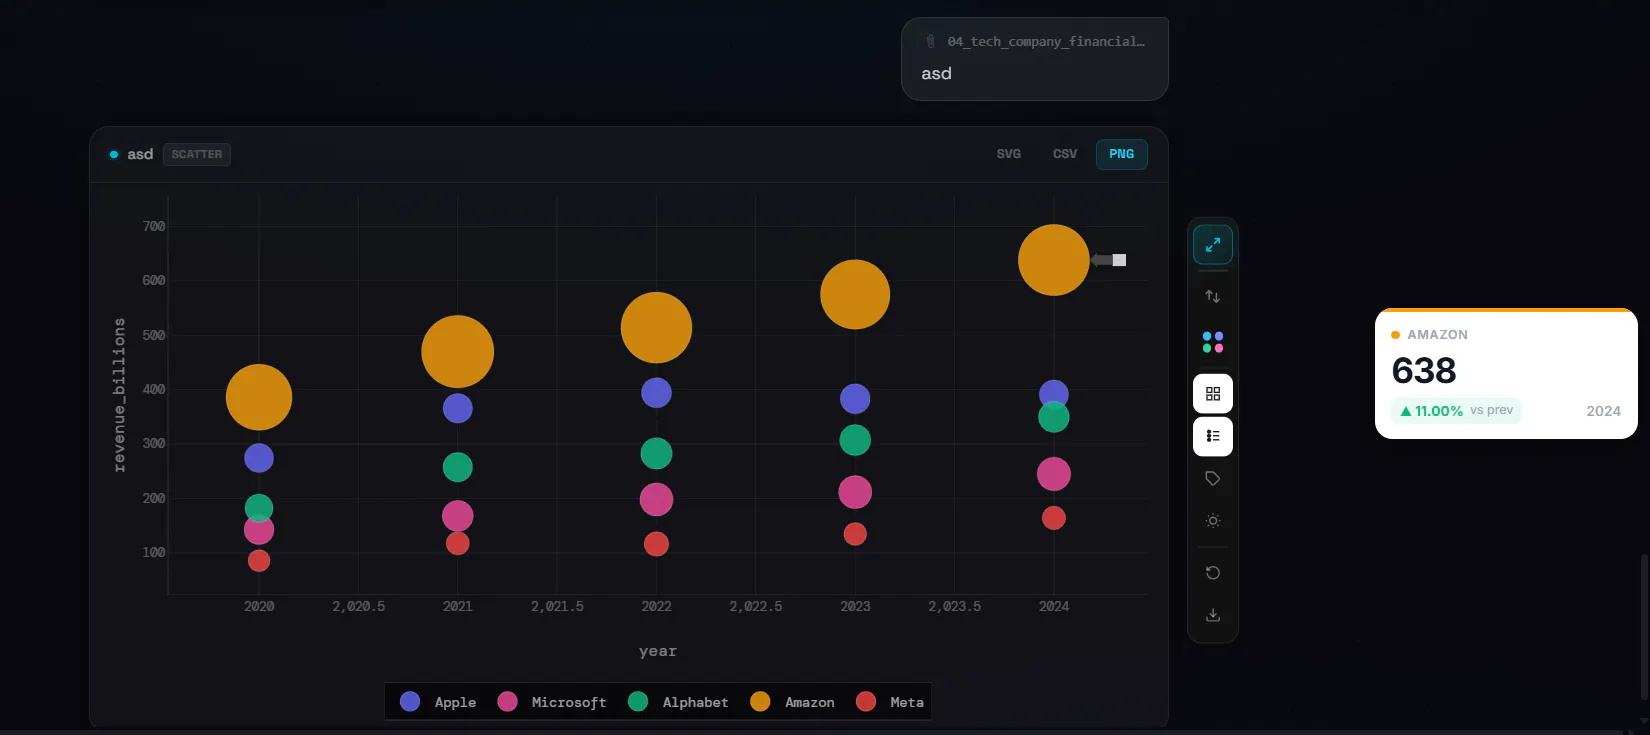
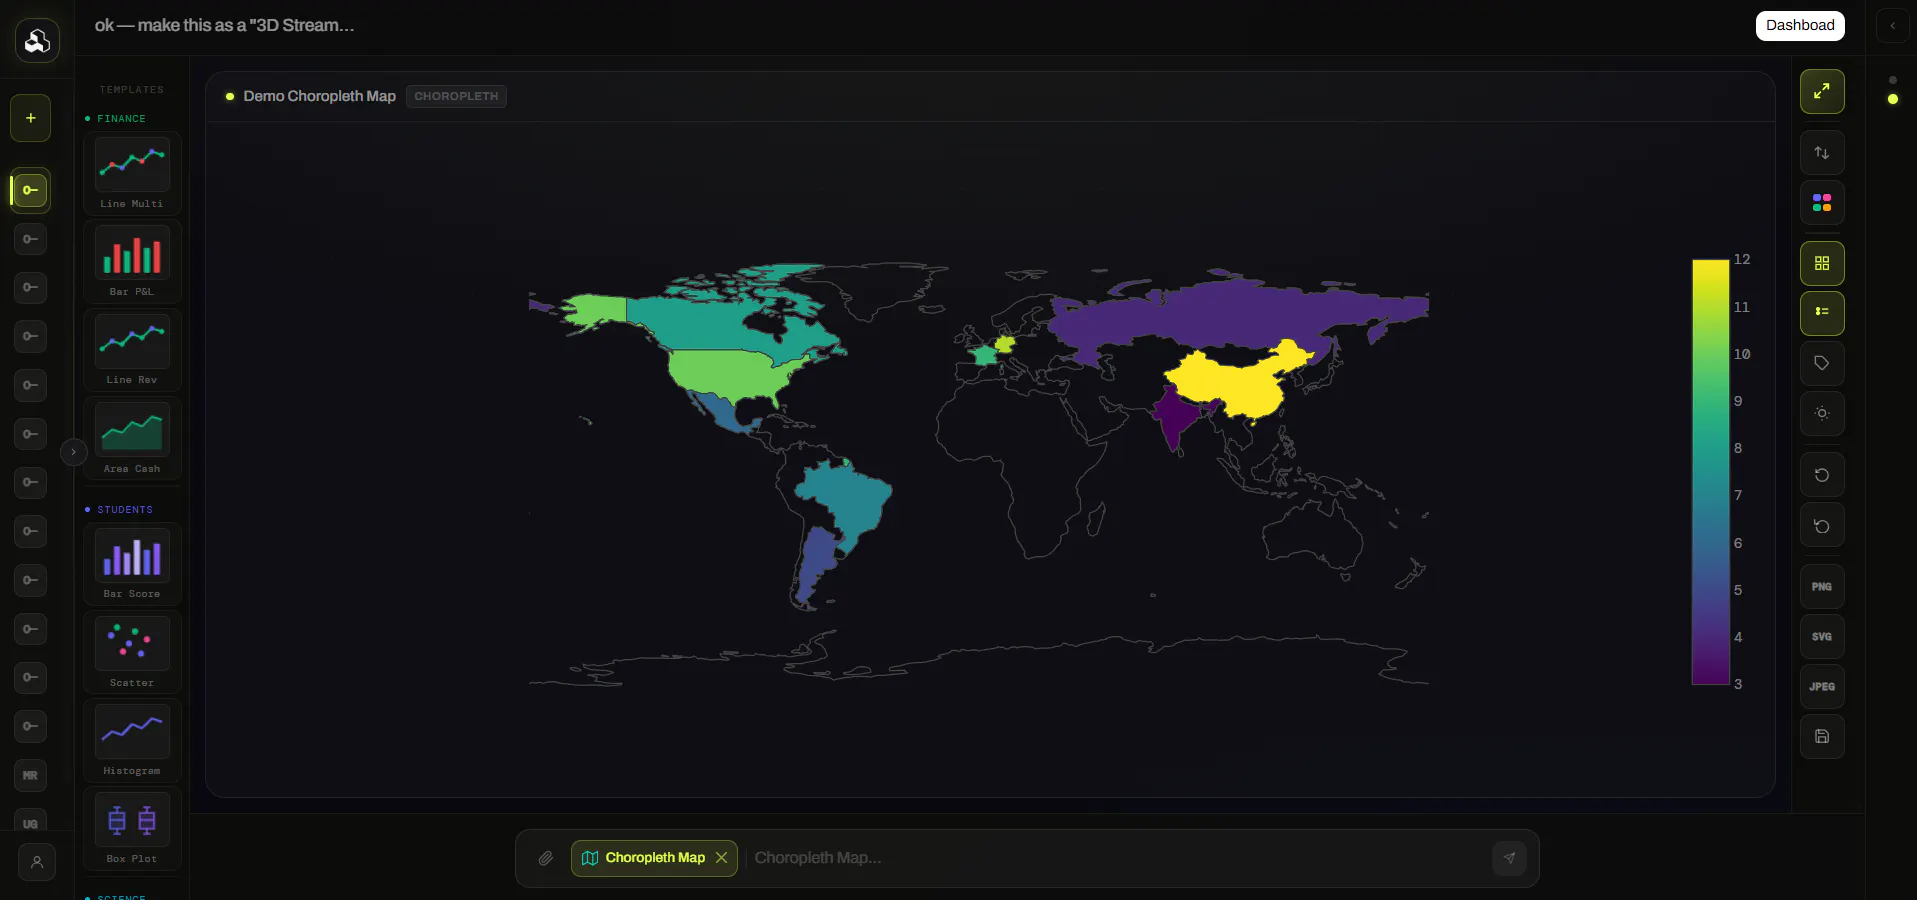
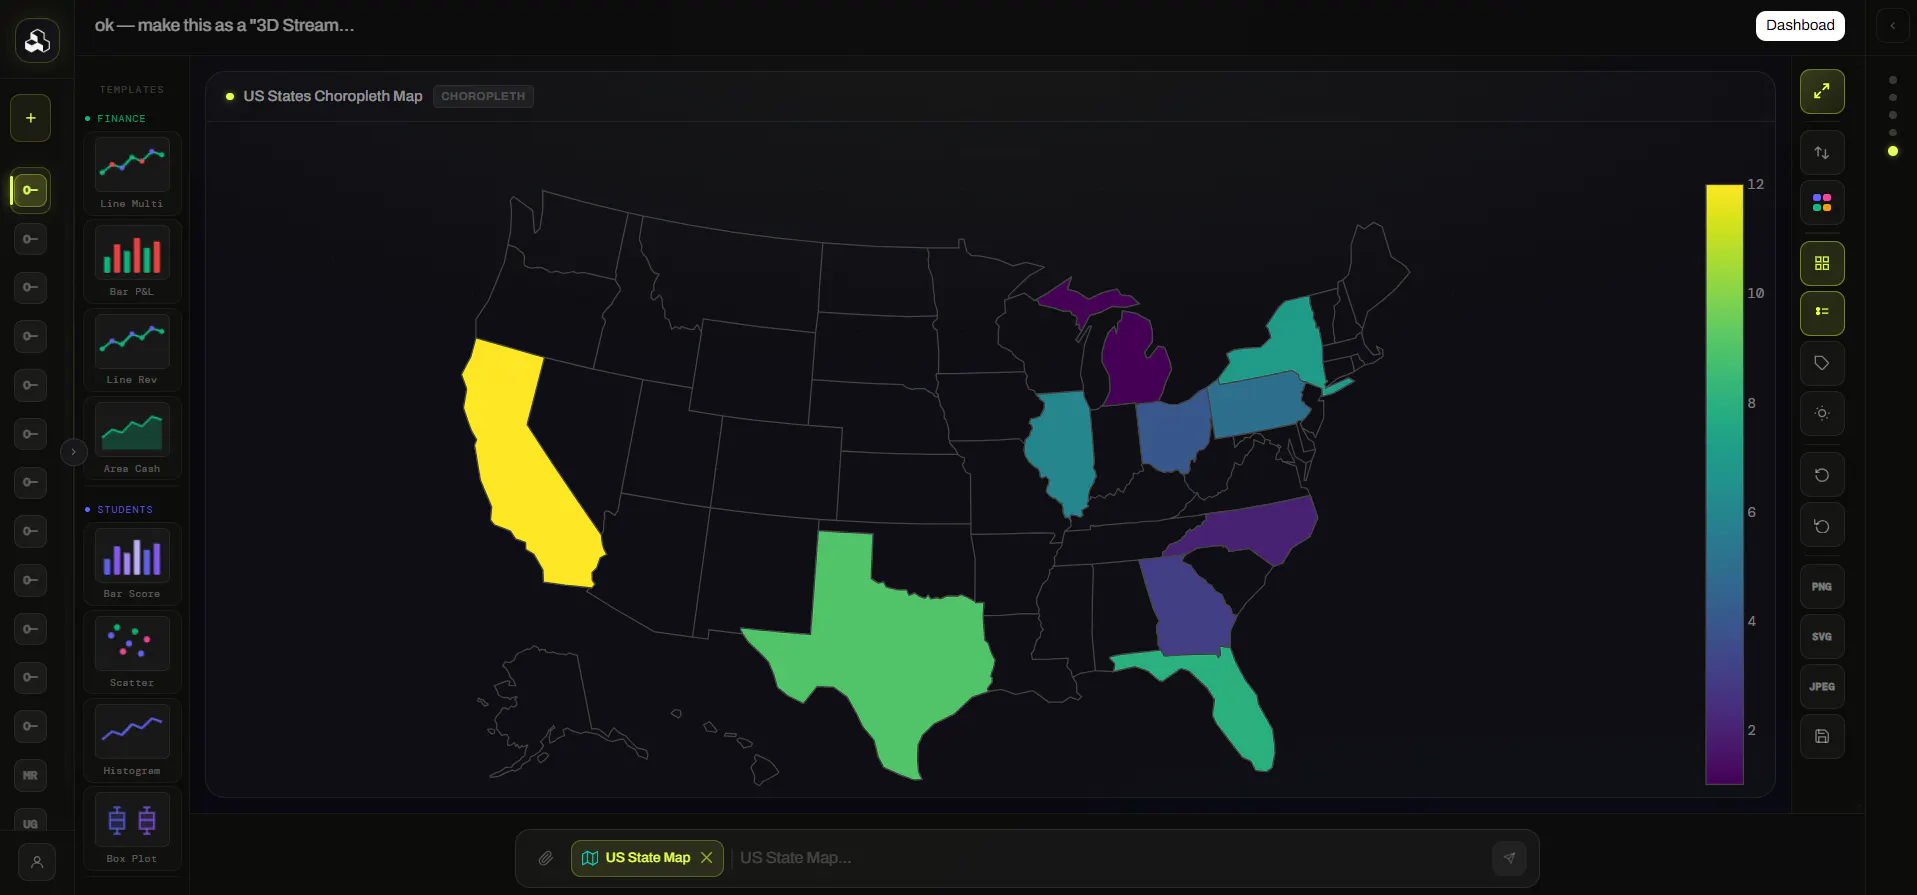
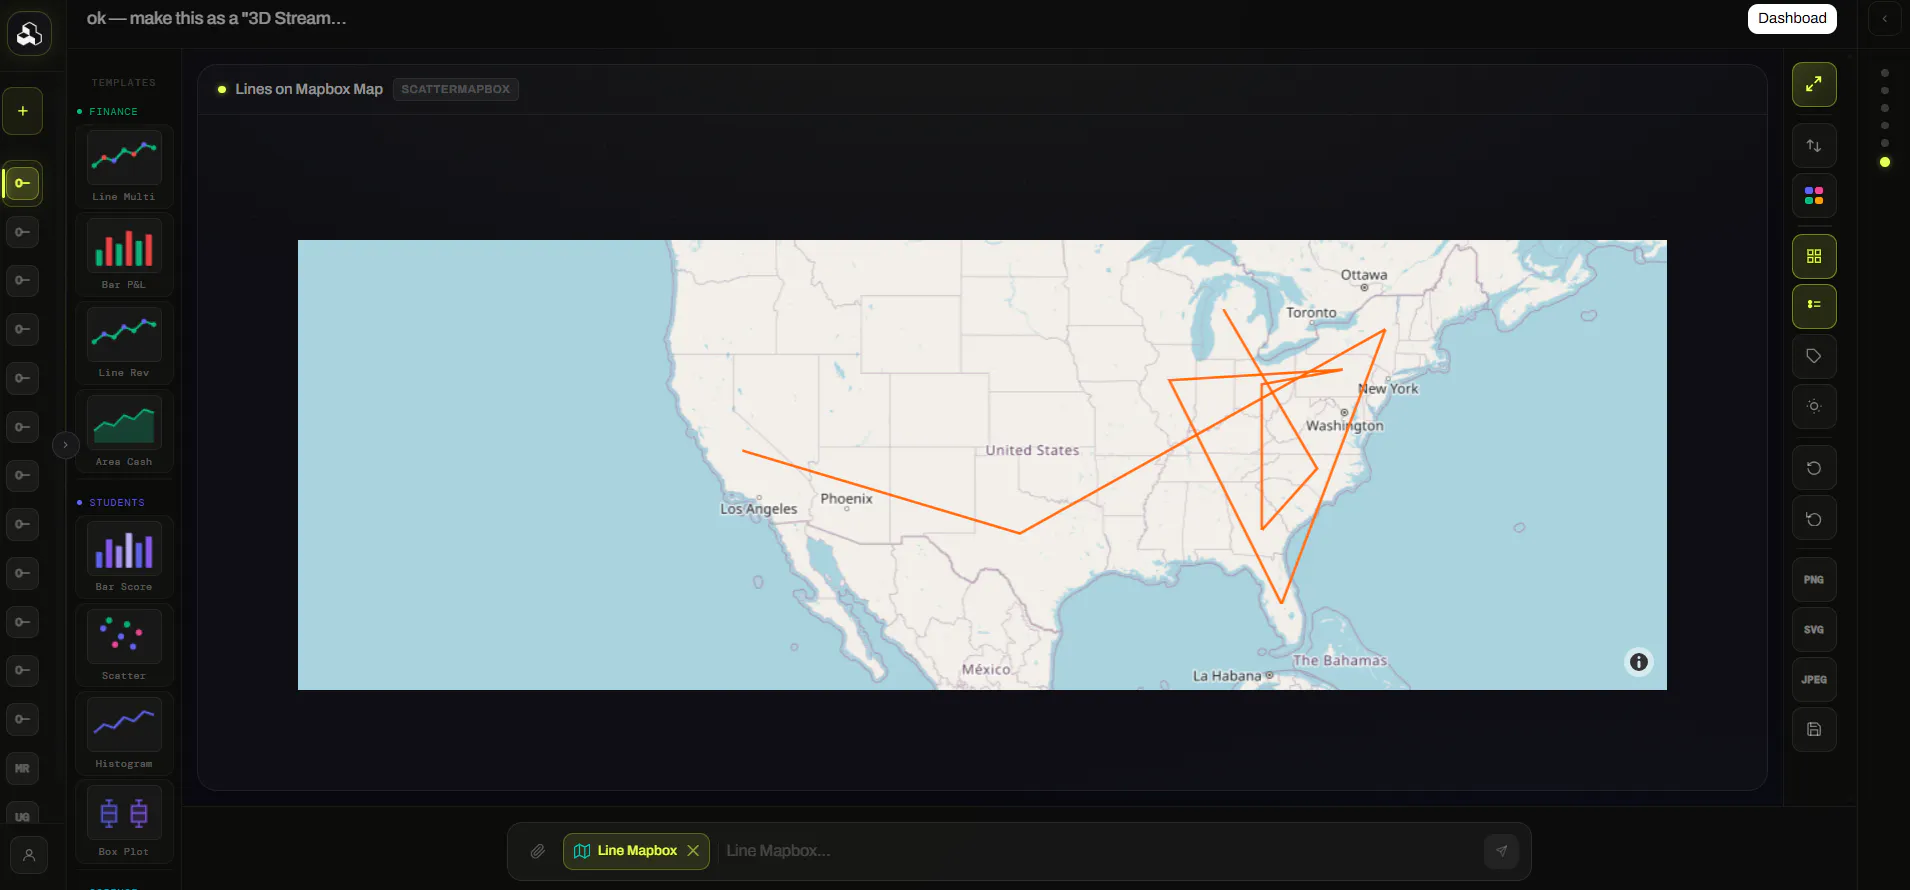
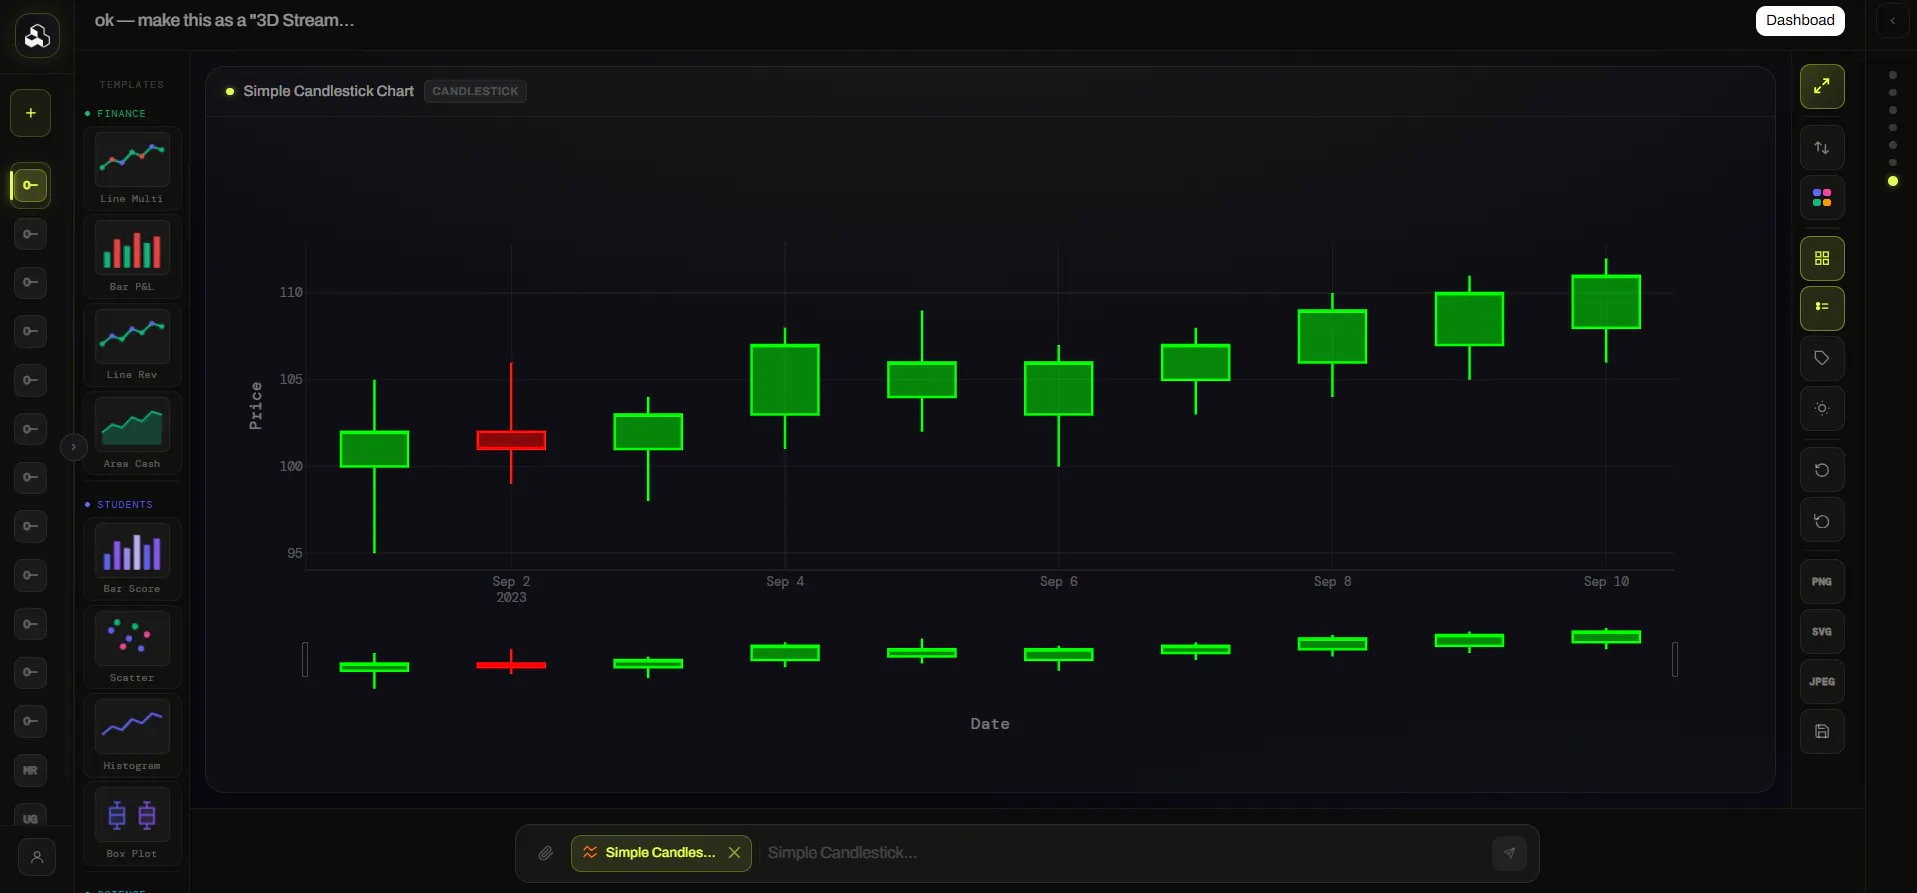
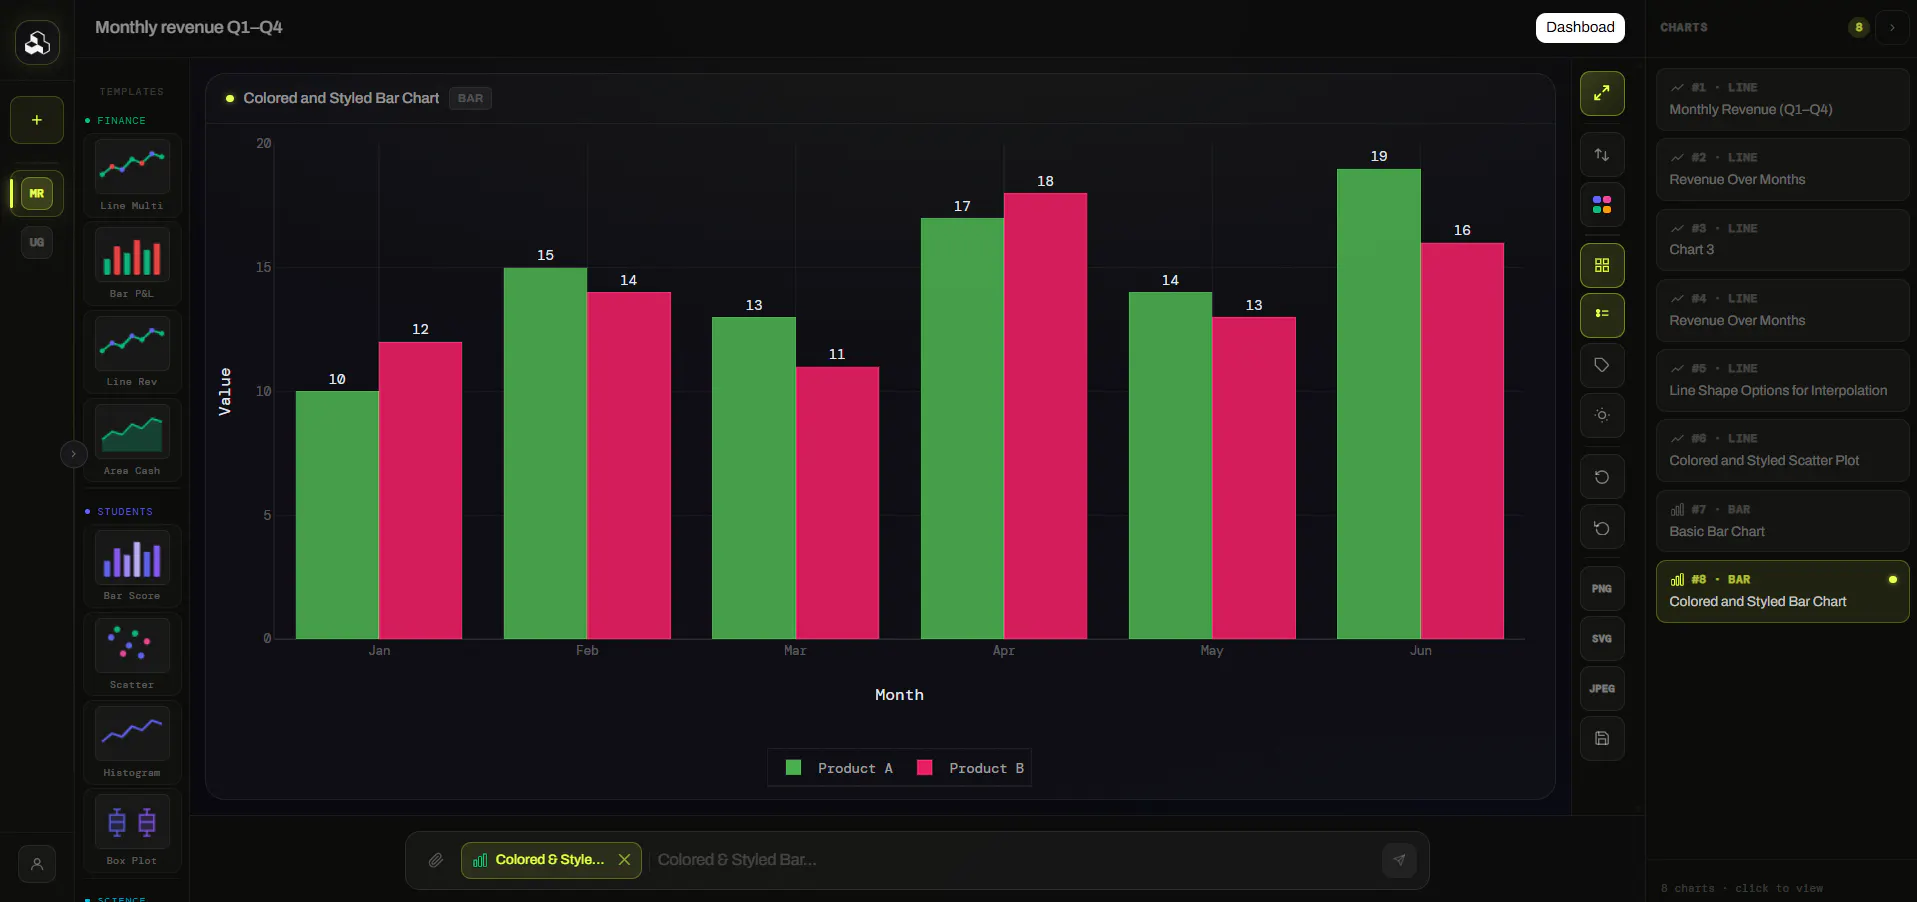
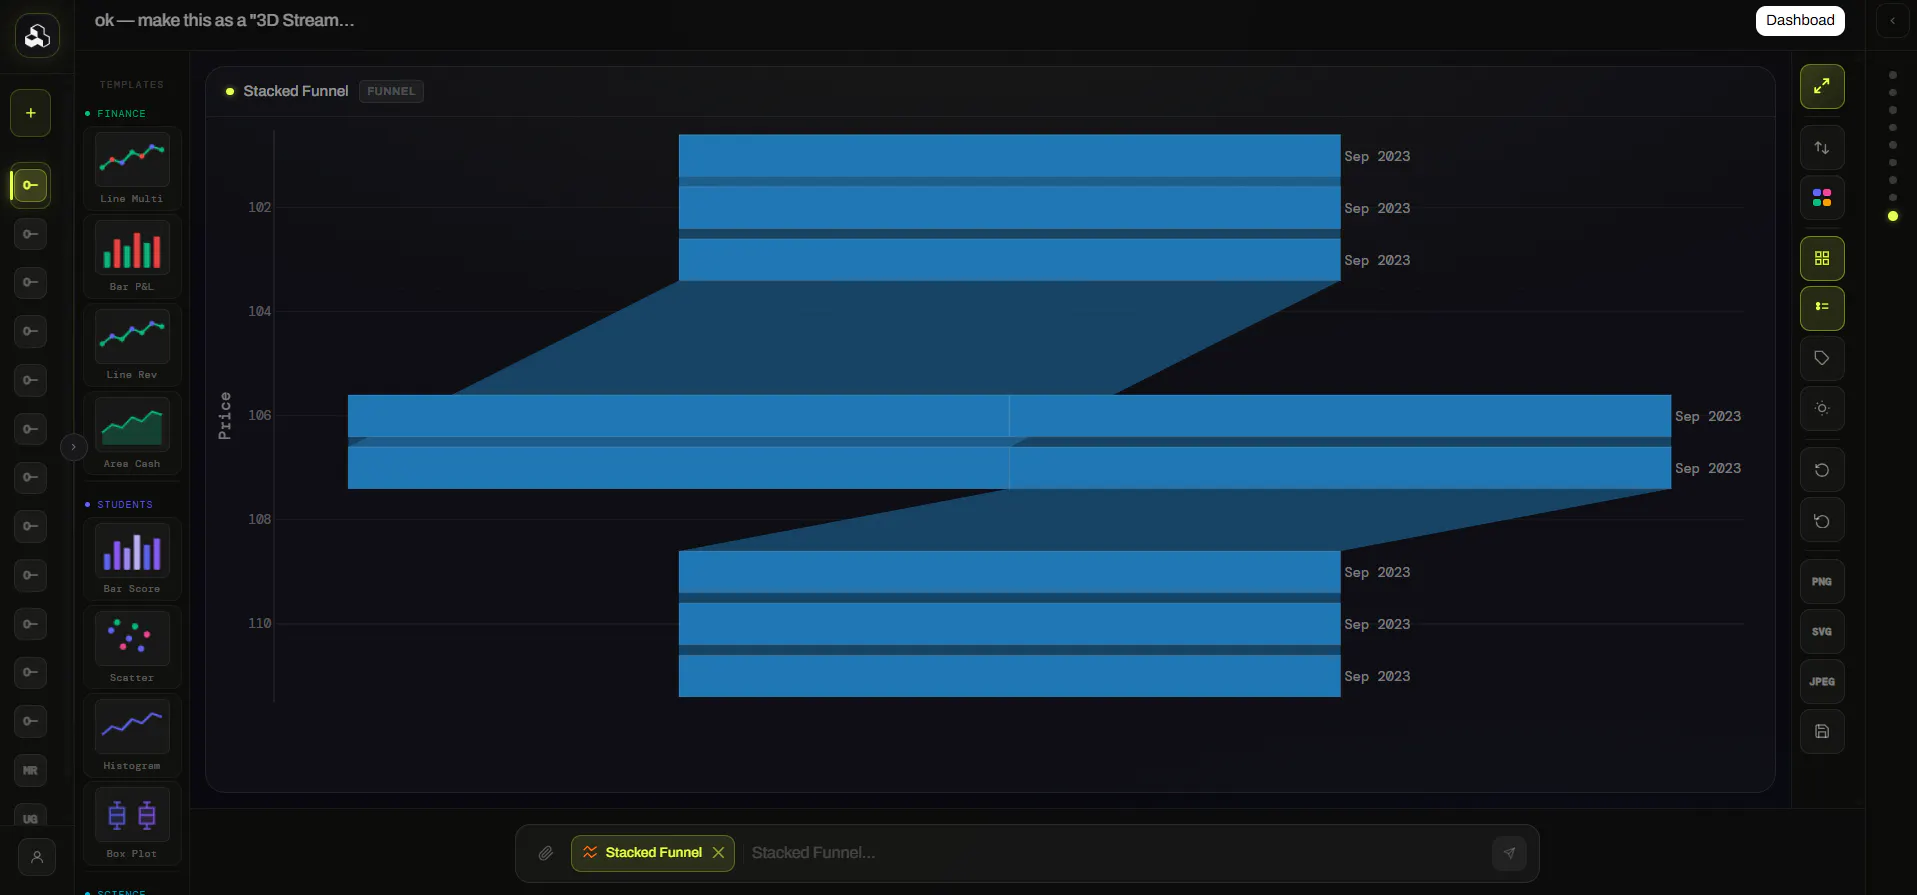
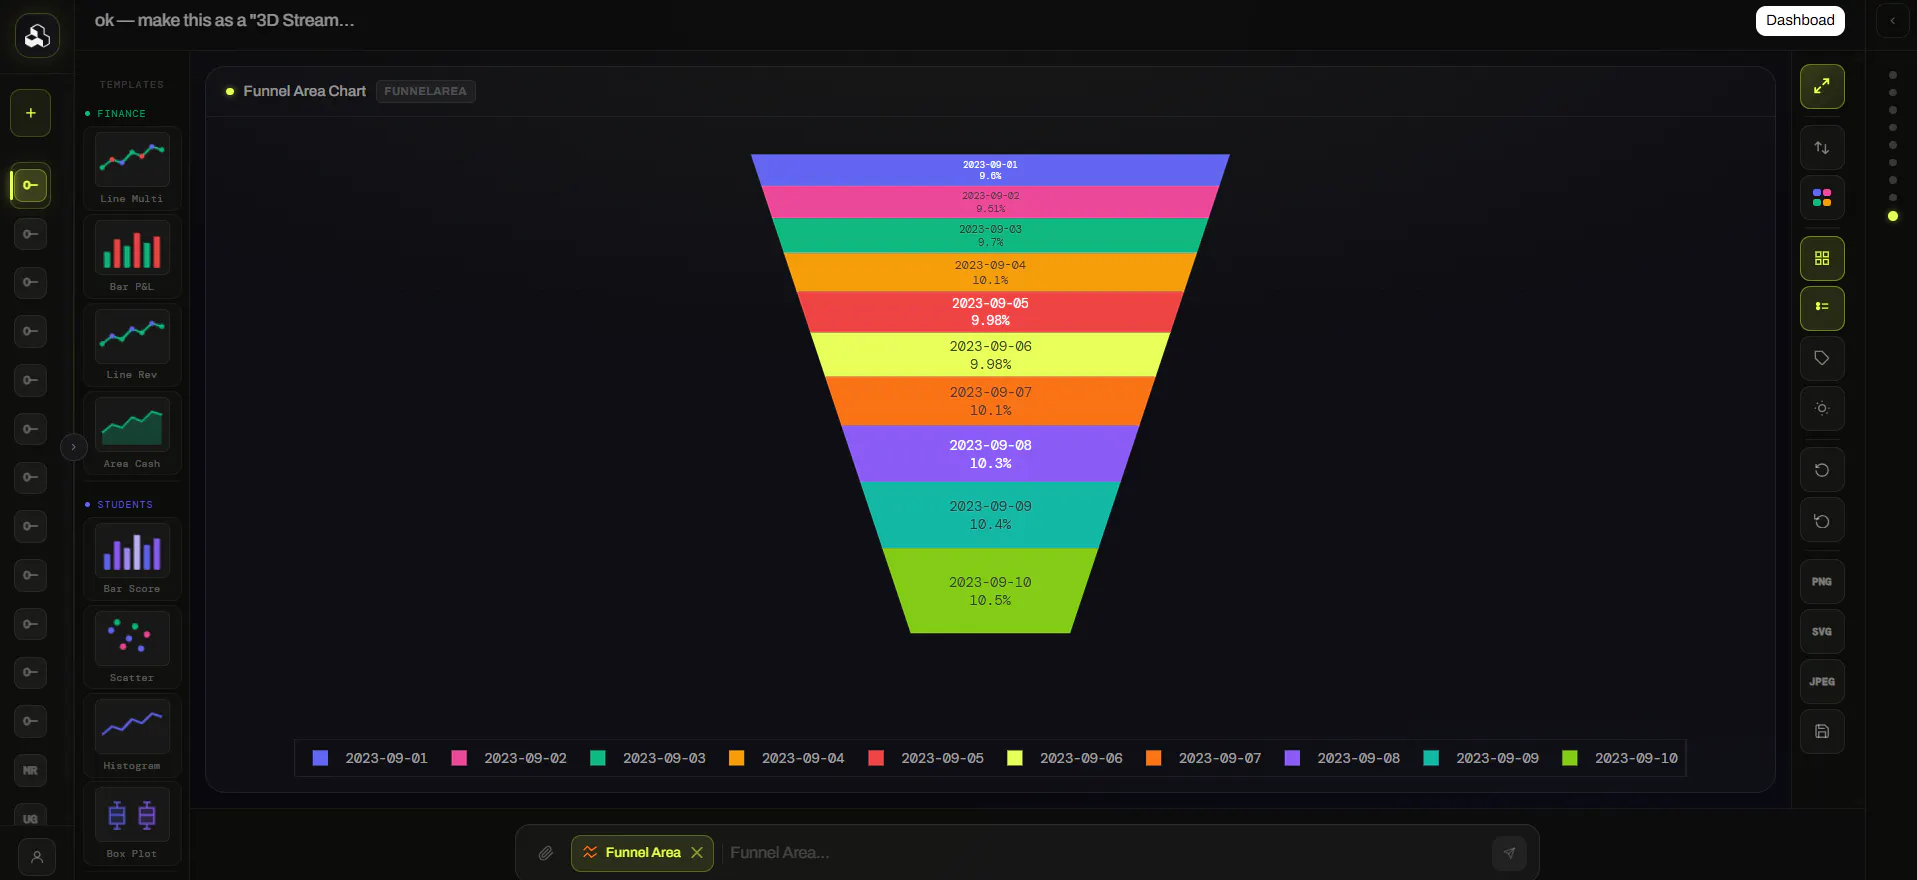
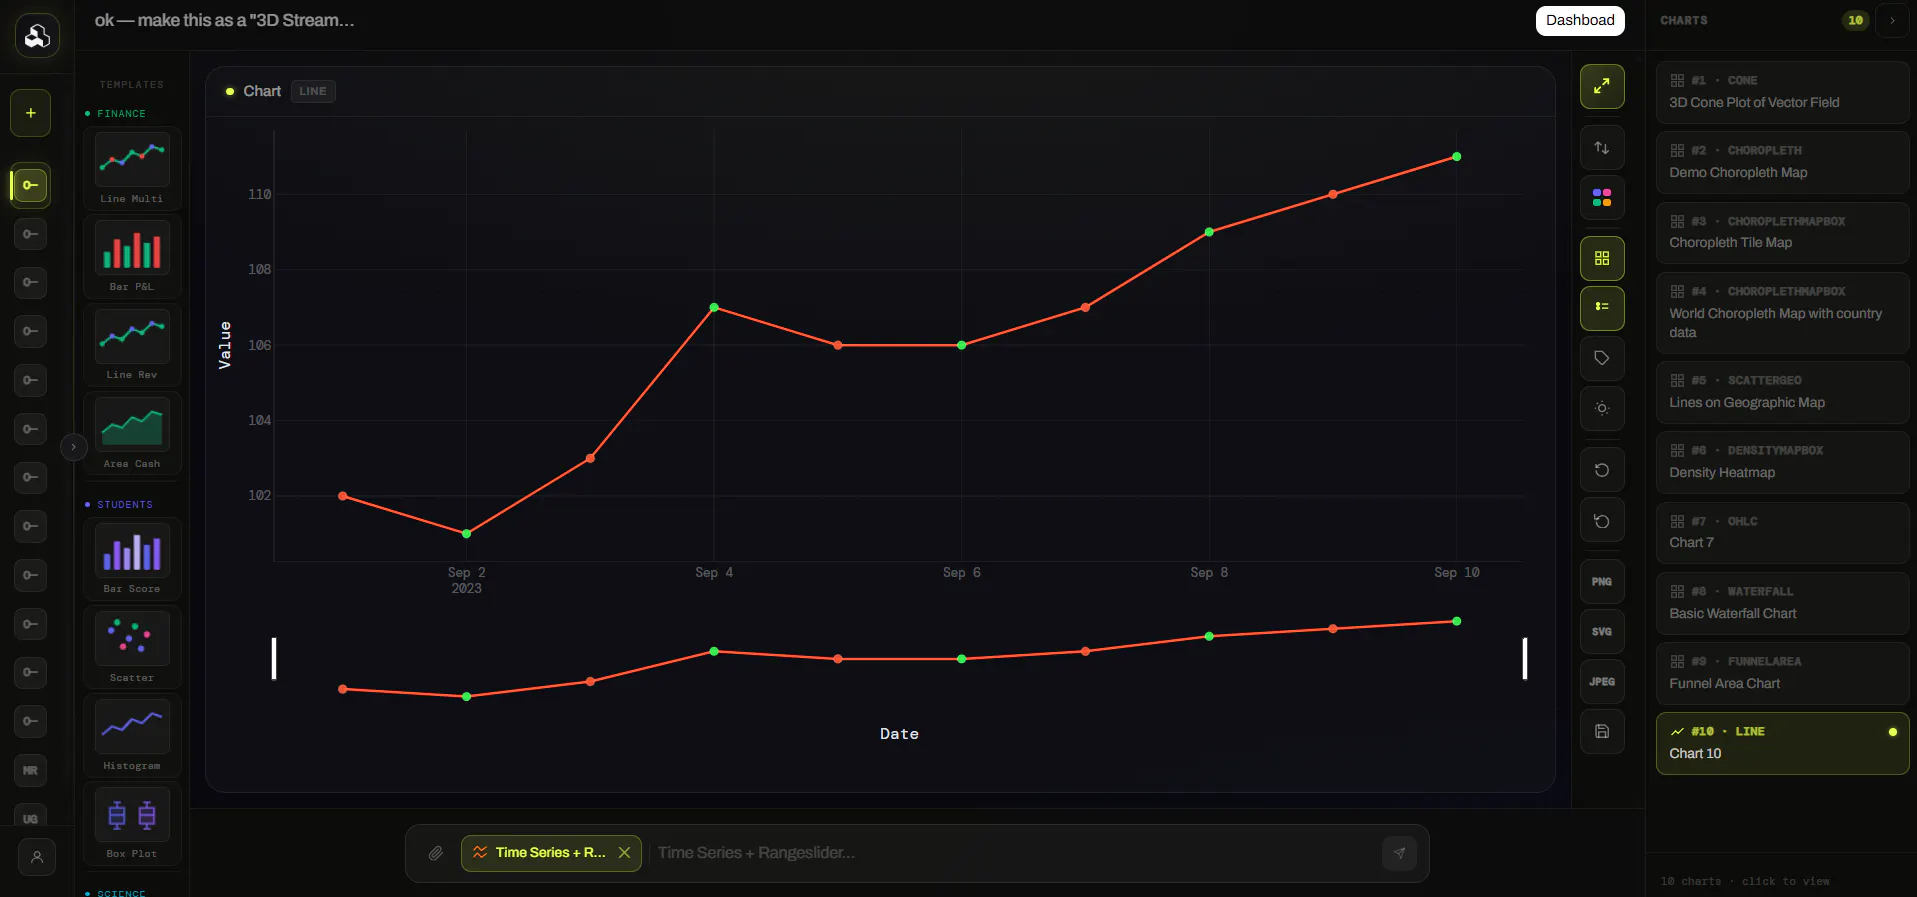
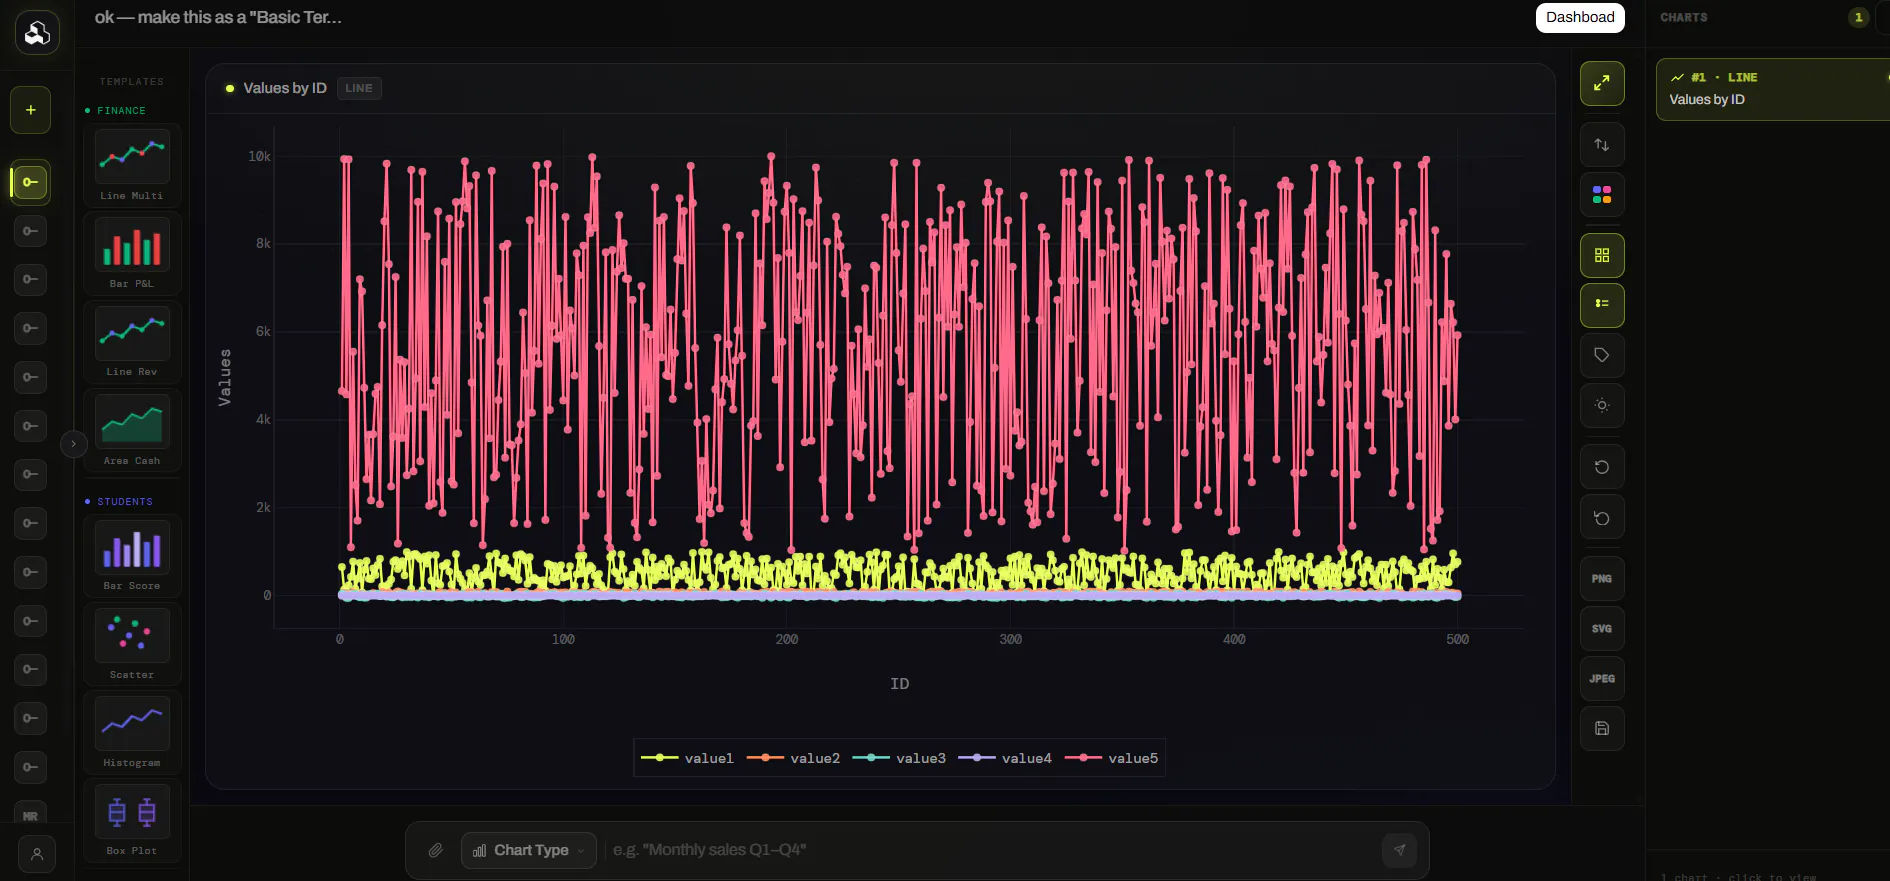
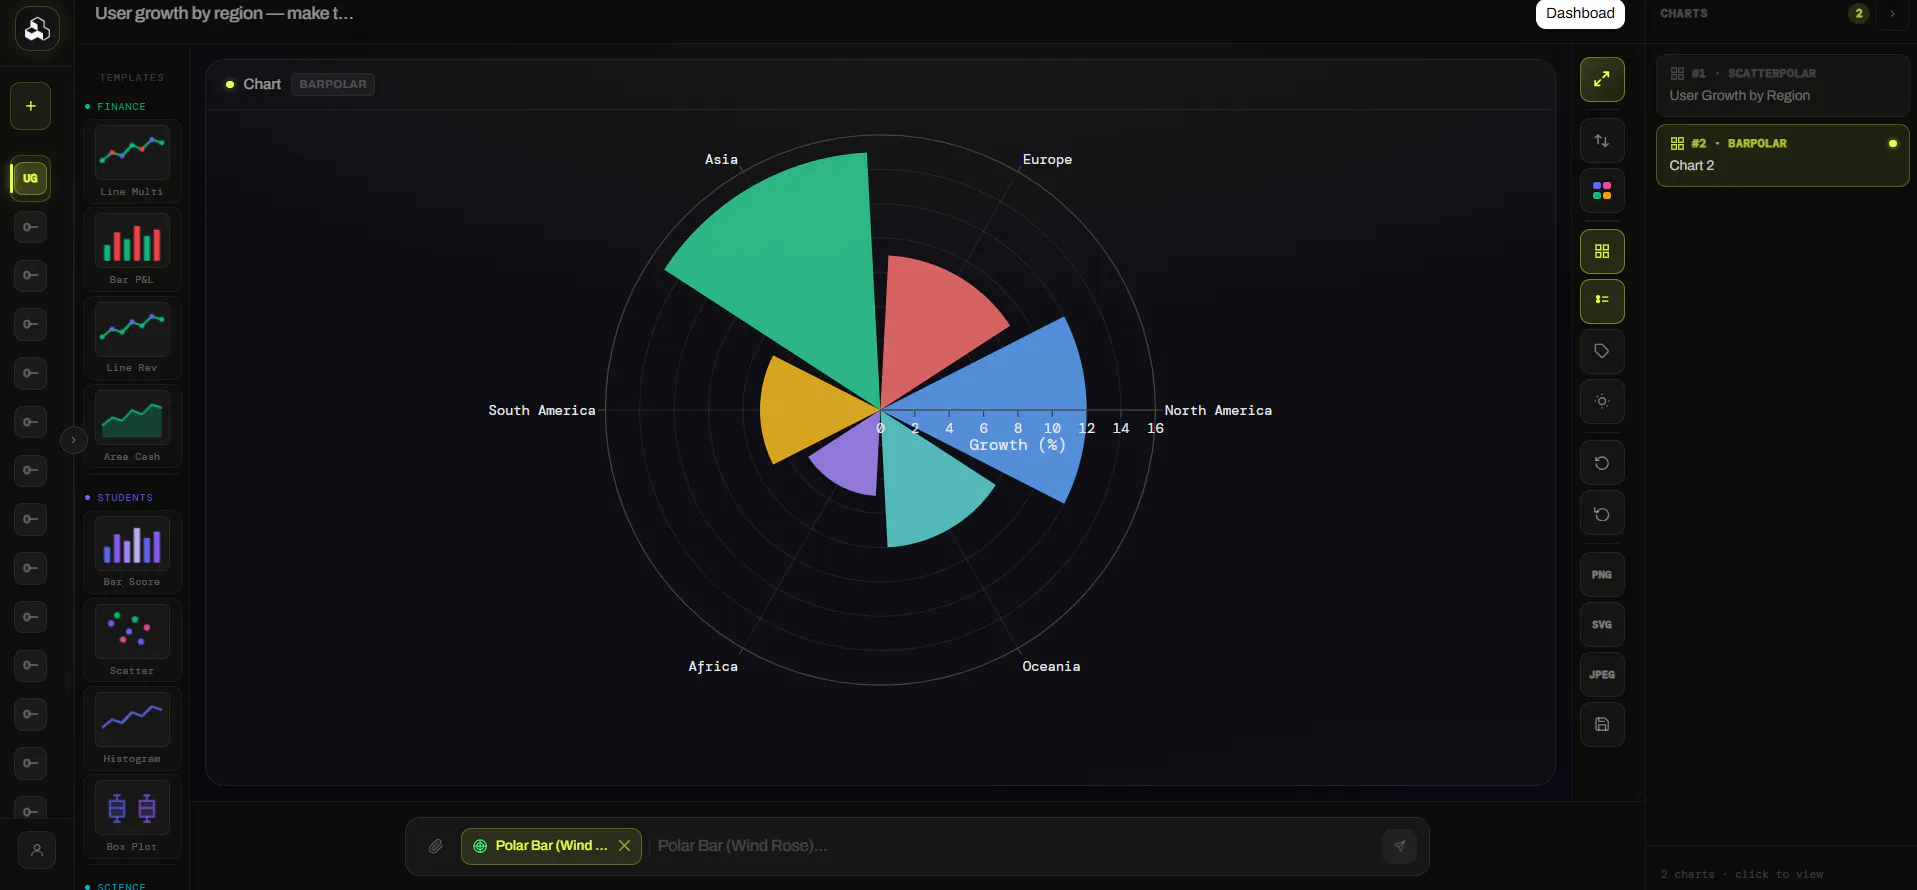
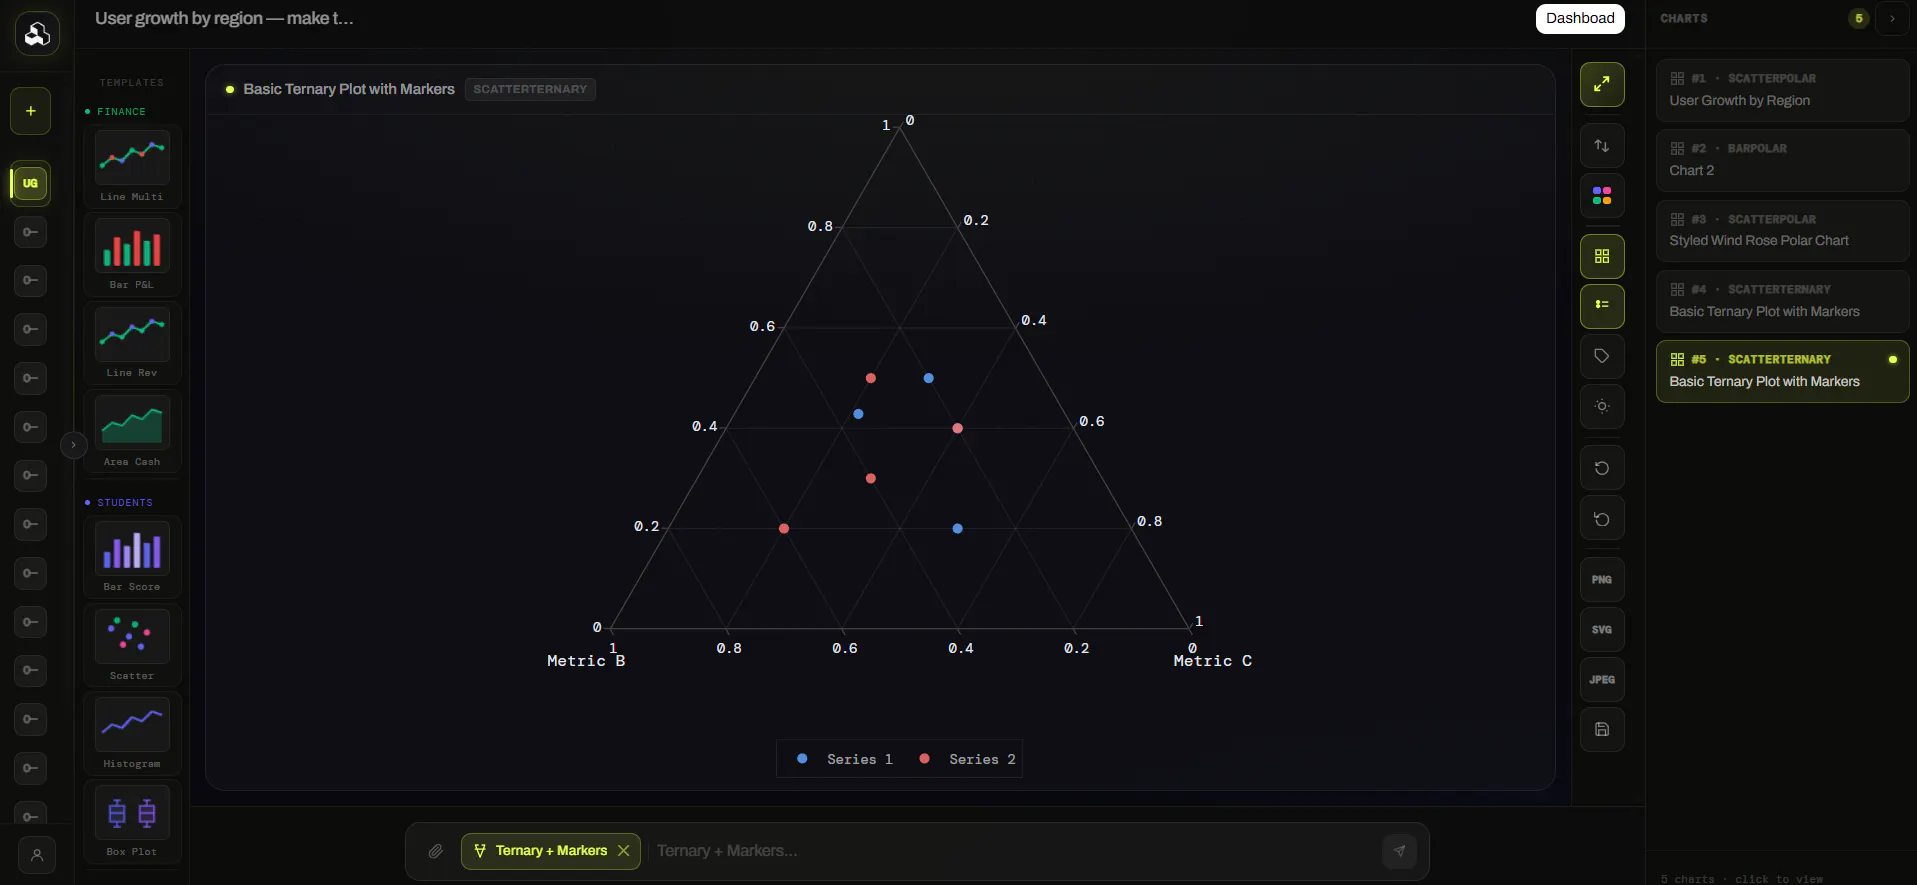
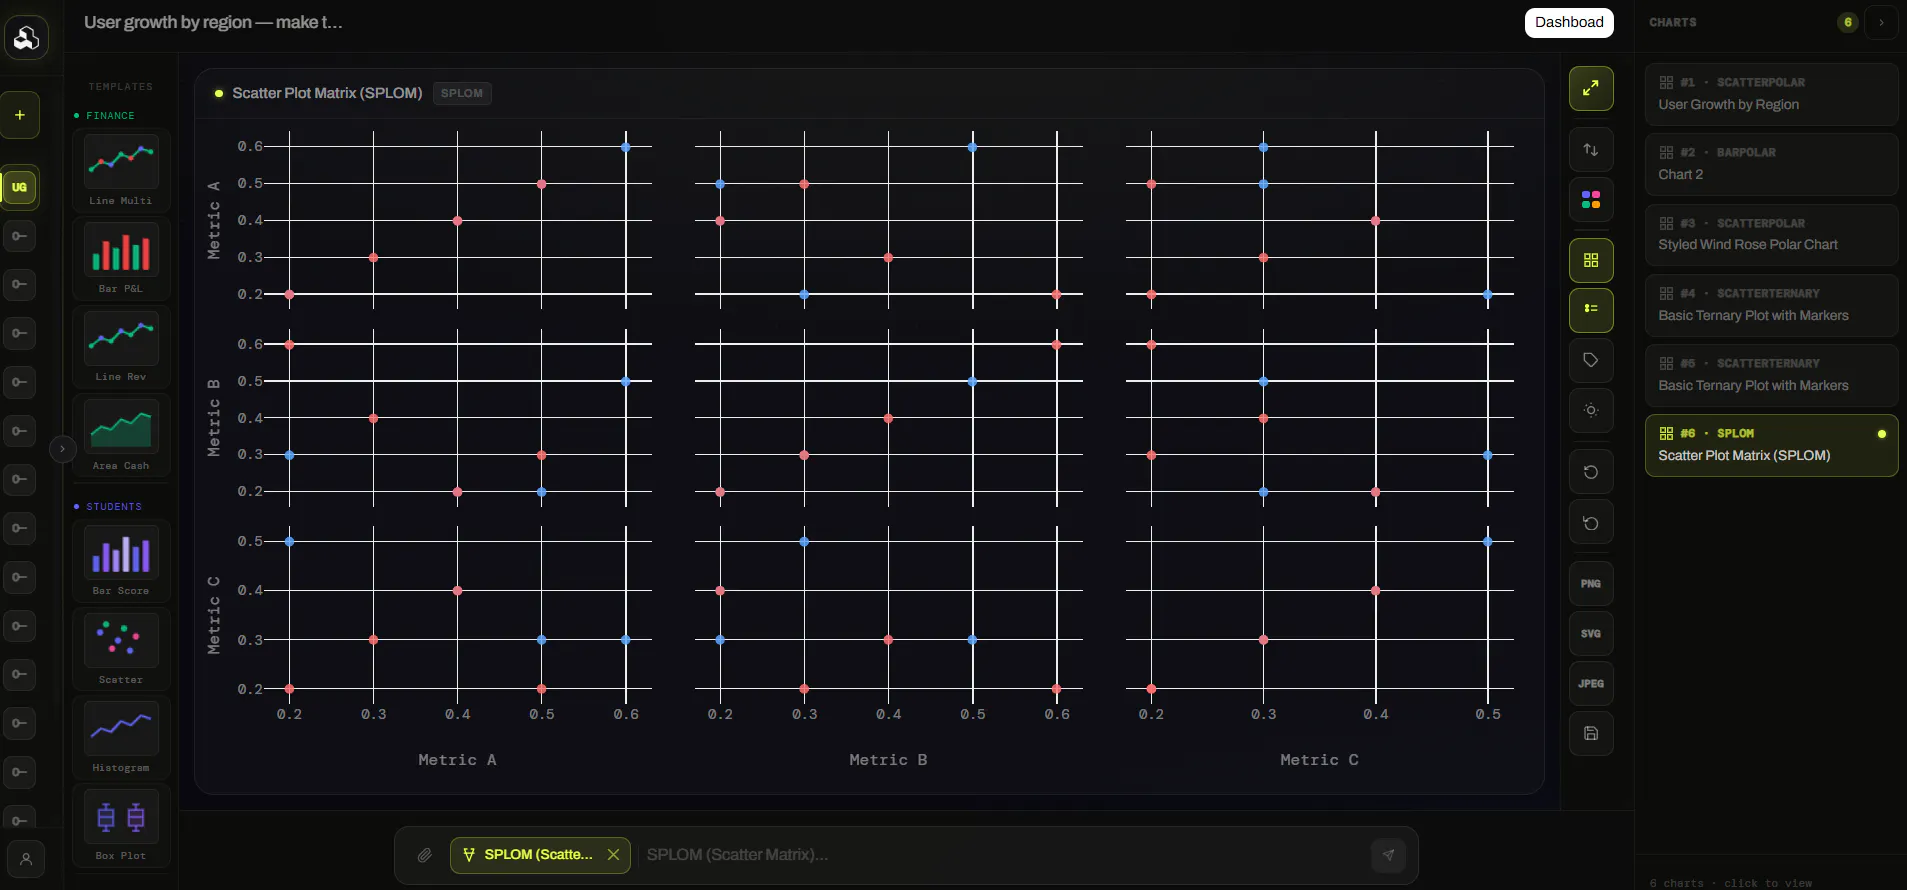
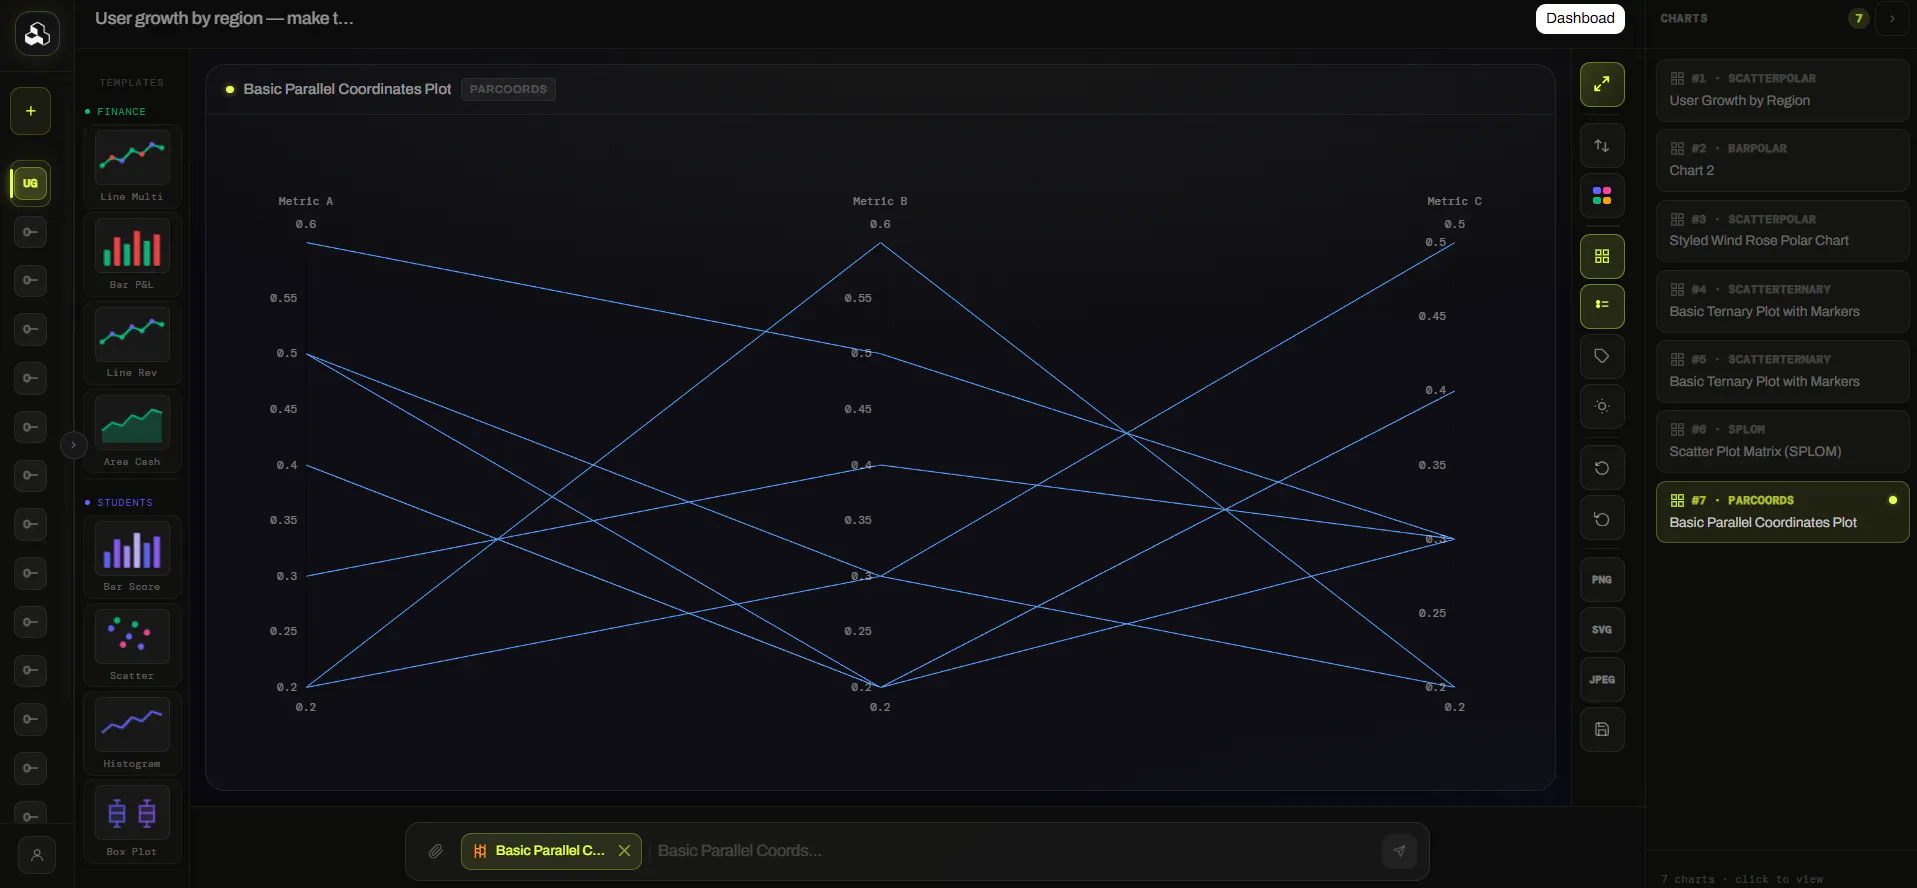
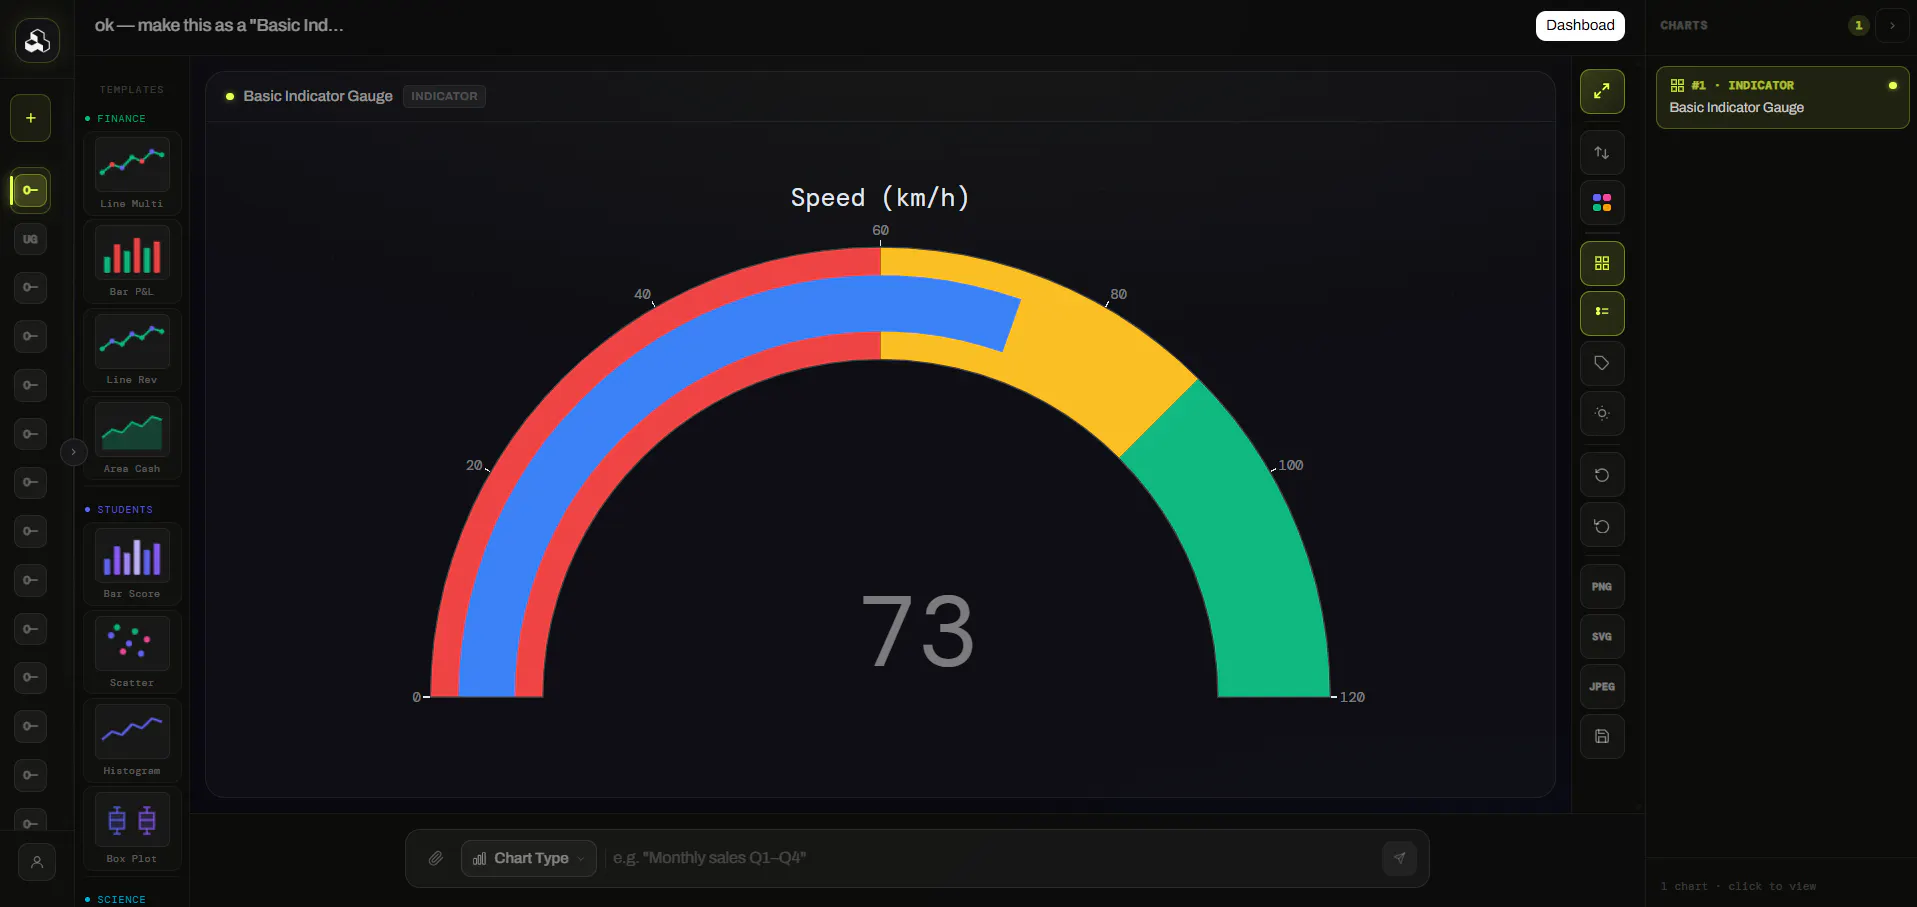
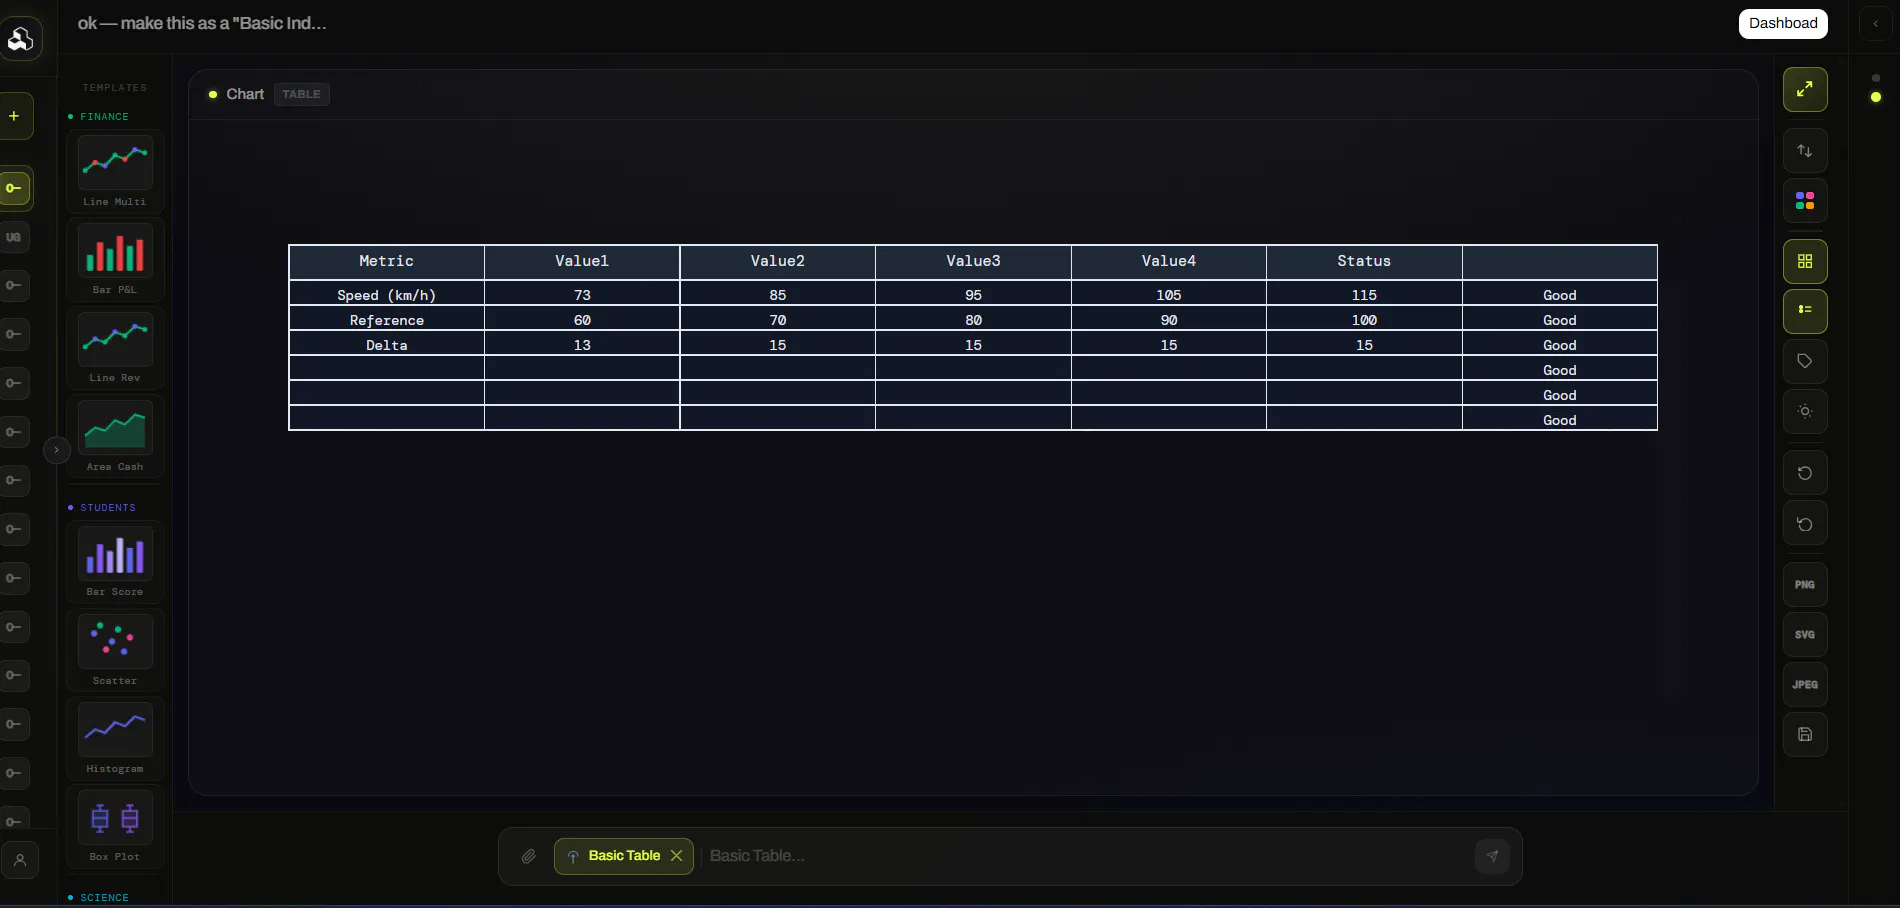
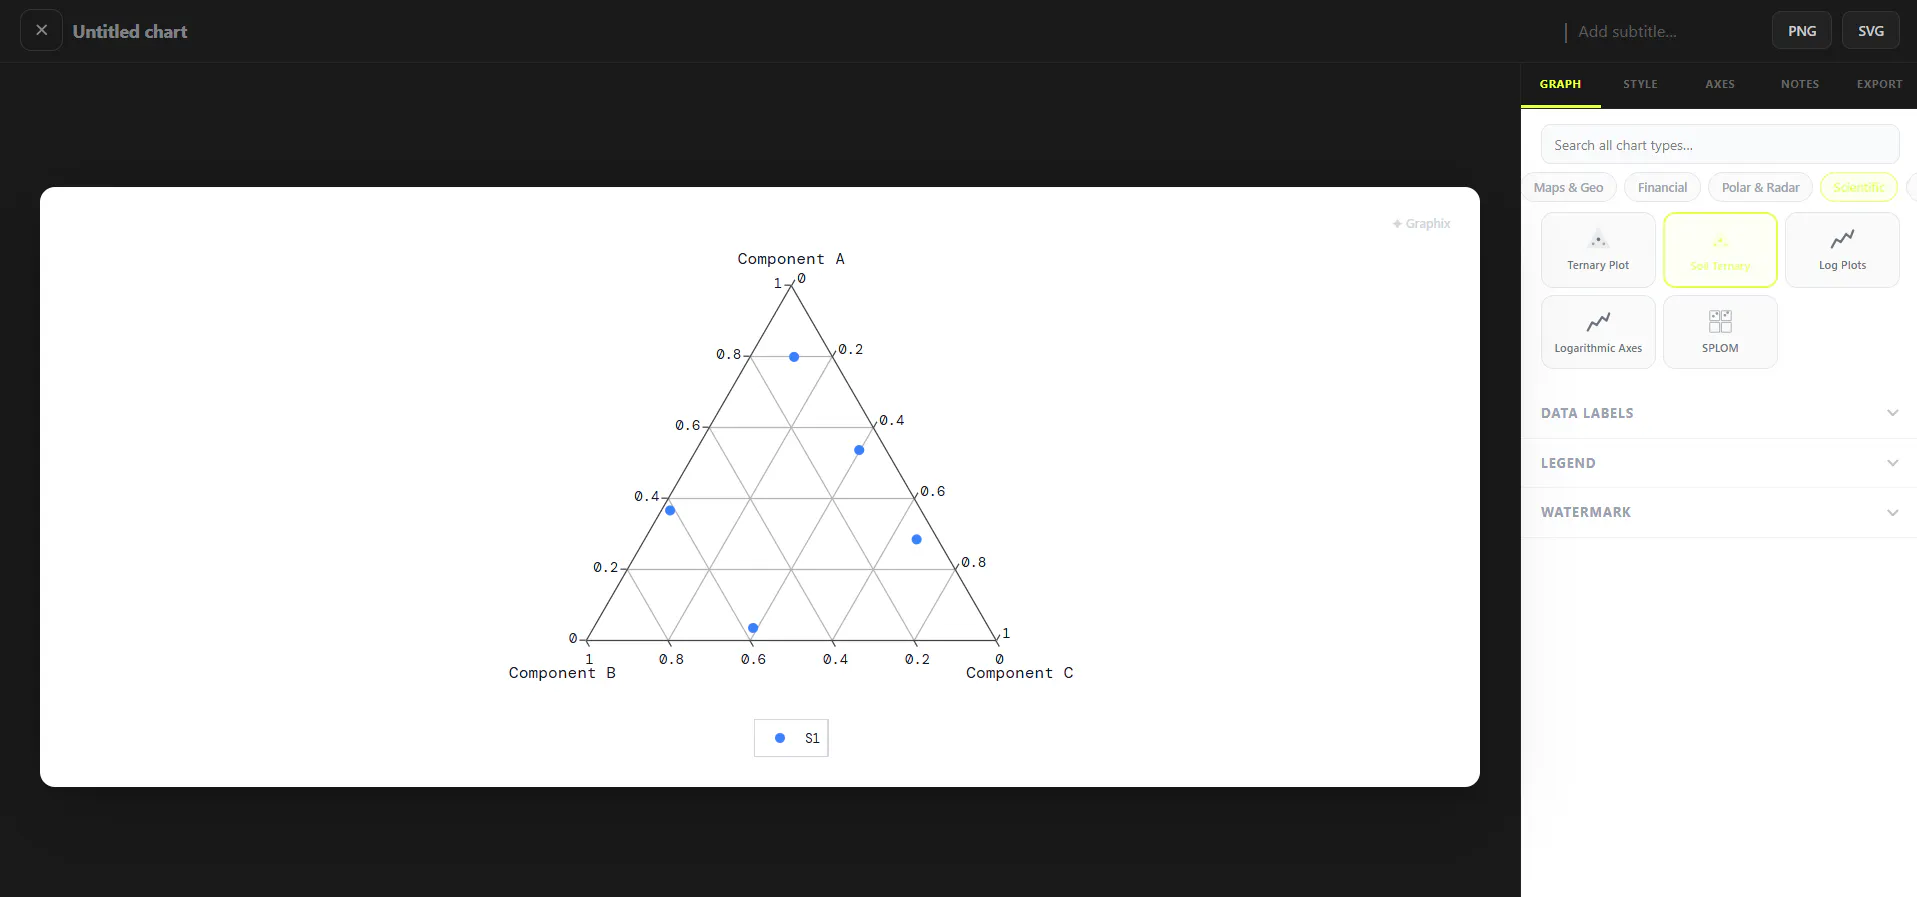
Turn your data inGraphix turns plain English into charts. Describe what you want to see, or upload a CSV, and get an interactive chart from 140+ types — bar, 3D surface, Sankey, candlestick, and more. Free while in beta, no card required.to beautiful charts with AI
AnalyticsDeveloper ToolsArtificial Intelligence
Advertisement (Responsive)
💬 Comments
📋 Details
Launched
August 31, 2026
Upvotes
1
Comments
1
Source
Public data
Advertisement (Responsive)






This tool has 1 comments on Product Hunt.
View comments on Product Hunt →